
یہ بھی دیکھیں


 17.09.2026 10:57 AM
The 4-hour (H4) chart for the USD/JPY pair reveals a significant structural shift in price action; the price is currently trading at 155.78, holding above key support levels following successive breakouts from bearish channels.
Technical Reading and Price Action
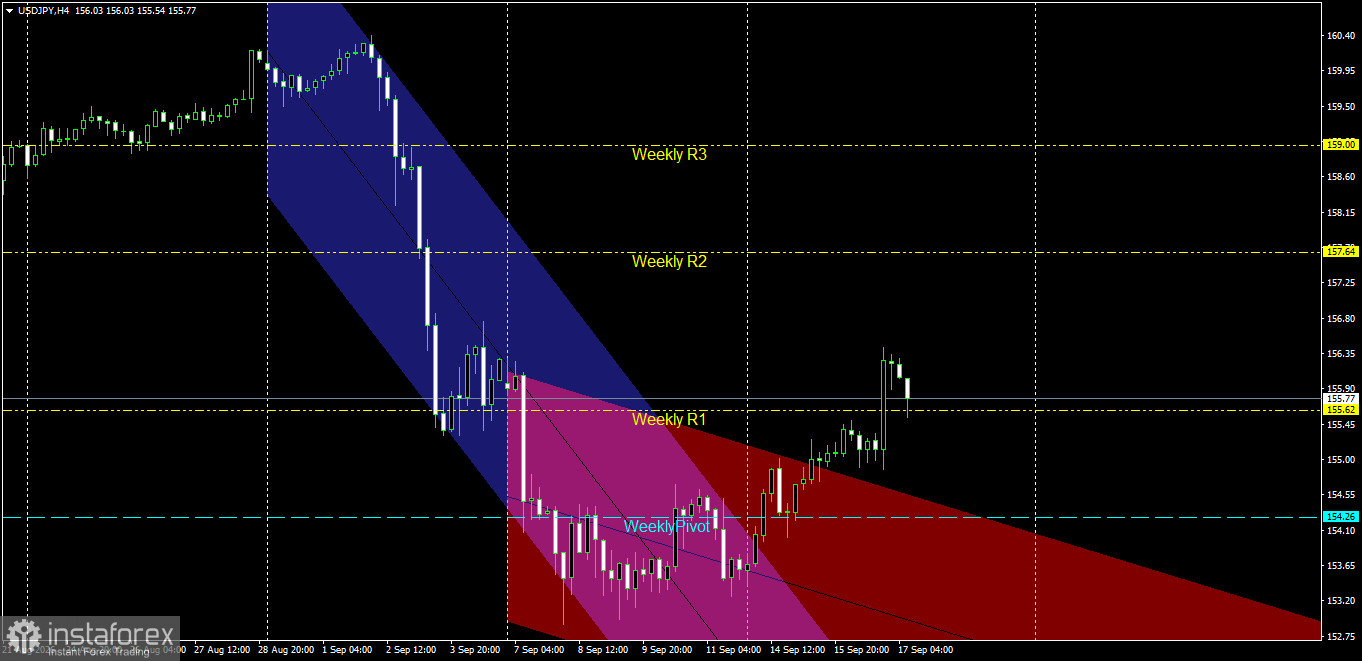
Breaking Successive Bearish Channels: The price initially moved within a primary bearish channel (blue), reflecting a strong sell-off, before shifting into a narrower, steeper corrective channel (red). Buyers managed to break out of the red channel to the upside and subsequently breached the upper boundary of the primary blue channel, officially signaling the end of the temporary bearish trend.
Breaking the Pivot Point and First Resistance: The price rebounded strongly from the pivotal low recorded near 153.20–153.40. It continued its upward momentum, breaking the Weekly Pivot level at 154.26 and surpassing the first weekly resistance level (Weekly R1) at 155.62, eventually reaching a local high near 156.35.
Key Support and Resistance Levels
Key Resistance Levels:
Resistance 1: The current peak range between 156.35 and 156.80.
Resistance 2: The 157.64 level (Weekly R2).
Key Resistance: The 159.00 level (Weekly R3). Key Support Levels:
First Support: 155.62 (the broken Weekly R1, now acting as a support zone).
Second Support: Weekly Pivot level at 154.26.
Key Support: The 153.20–153.40 price range (level invalidating the bullish scenario).
Price Action Outlook and Trading Scenarios
Bullish Scenario (Primary):
The bullish scenario is the most likely outcome, supported by price consolidation above the previously broken channel boundaries and the Weekly Pivot level.
Validation Condition: Sustained stability above 155.62 or a successful retest in the 155.00–155.50 range.
Technical Targets: Breaking back above the 156.35 peak to target 157.64 as the primary objective, followed by a move toward 159.00.
Stop-Loss: A 4-hour candle close below 154.20.
Bearish Scenario (Alternative):
Triggered if the price faces sudden selling pressure that pushes it back into the previously broken channel range.
Validation Condition: Breaking below the Weekly Pivot level (154.26) and holding there with a 4-hour candle close.
Technical Targets: Retesting the previous low at 153.20.
Risk Management
It is advisable to capitalize on opportunities aligned with the current bullish momentum and avoid selling against the trend. Strict adherence to placing stop-loss orders below the specified support levels is essential to protect capital.
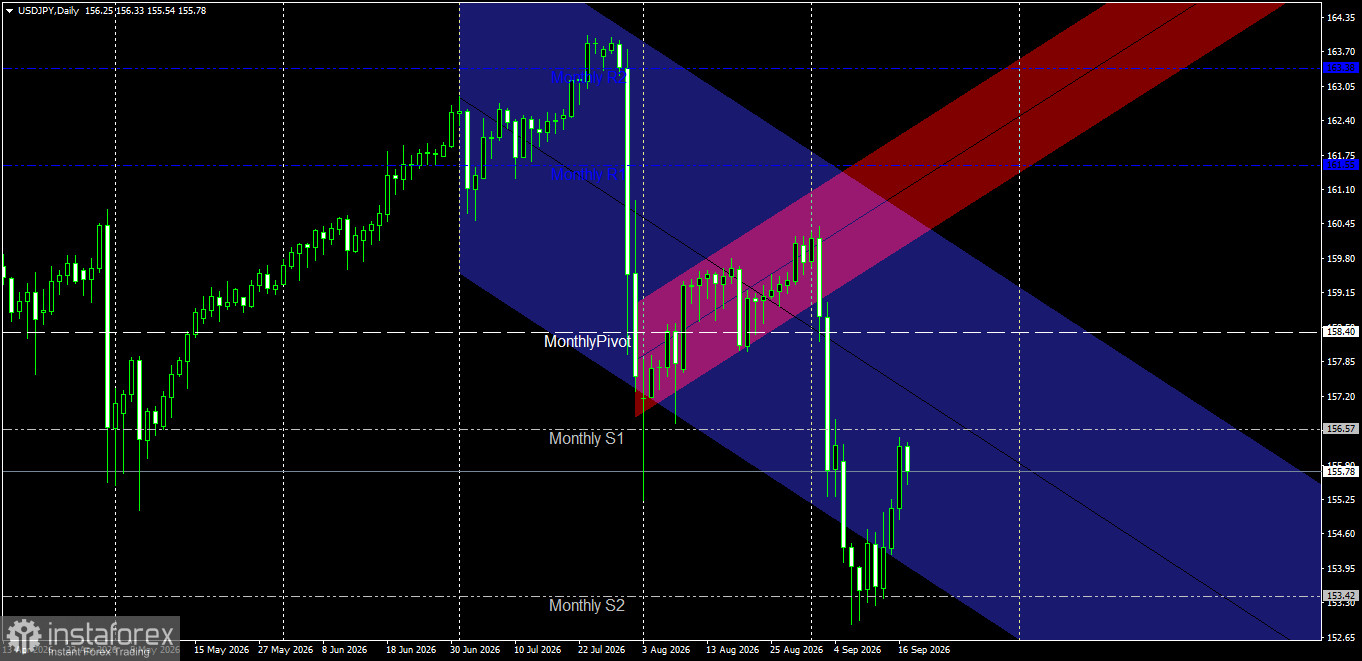
The daily chart for the USD/JPY pair reveals significant price action reflecting a fierce battle between selling and buying forces. The price is currently trading around the 155.78 level, following a strong rebound from the pivotal low near the second monthly support level (Monthly S2).
Technical Analysis and Price Action
Overlapping Price Channel Structure:
Primary Bearish Channel (Blue): Dominates the pair's medium-term trend; the decline originated from the historical peak recorded near the second monthly resistance level (Monthly R2) at 163.38.
Broken Bullish Sub-channel (Red): Represented a temporary upward corrective move; however, the price experienced a sharp break and a vertical drop, exiting the channel's lower boundary and heading toward the lower limit of the primary blue channel.
Rebound from Monthly S2: The price found firm footing at the pivotal support zone of 153.30–153.42—an area that intersects with the lower boundary of the blue bearish channel. Positive reversal price action emerged here, driving an upward surge to recoup some recent losses.
Testing the Broken Monthly S1: The price is currently approaching a test of the former support zone—now acting as resistance—at 156.57.
Pivotal Support and Resistance Levels
Key Resistance Levels:
First Resistance: 156.57 (Monthly S1).
Second Resistance: Monthly Pivot Point at 158.40. Third Resistance: 161.55 (Monthly R1).
Key Support Levels:
First Support: 154.60.
Key Support (Bullish Scenario Invalidation Point): The zone between 153.30 and 153.42 (Monthly S2).
Price Action Outlook and Trading Scenarios
Bullish Corrective Scenario (Primary):
The bullish scenario is the most likely in the short term, representing a corrective rebound wave following the touch of the blue channel's lower boundary.
Validation Condition: Breaking above the 156.57 resistance level and holding above it with a full daily candle.
Technical Targets: Targeting the monthly pivot point at 158.40 as the first target, followed by a move toward the midline of the bearish channel.
Stop Loss: A daily candle close below 154.50.
Bearish Scenario (Alternative):
This scenario activates if the price fails to surpass the 156.57 resistance and selling pressure returns, aligning with the overall trend of the blue channel.
Validation Condition: Holding below 156.57 or breaking the 153.30 support level.
Technical Targets: Retesting the previous low at 153.30; a break below this level opens the way for a decline toward 152.65. Risk Management
It is advisable to monitor the daily candle close near the 156.57 level to confirm the buyers' ability to break through before opening new long positions. Additionally, ensure that stop-loss orders are set to protect capital, and avoid trading with a risk exceeding 1% to 2% of the total account value.


