یہ بھی دیکھیں

 04.06.2025 02:20 PM
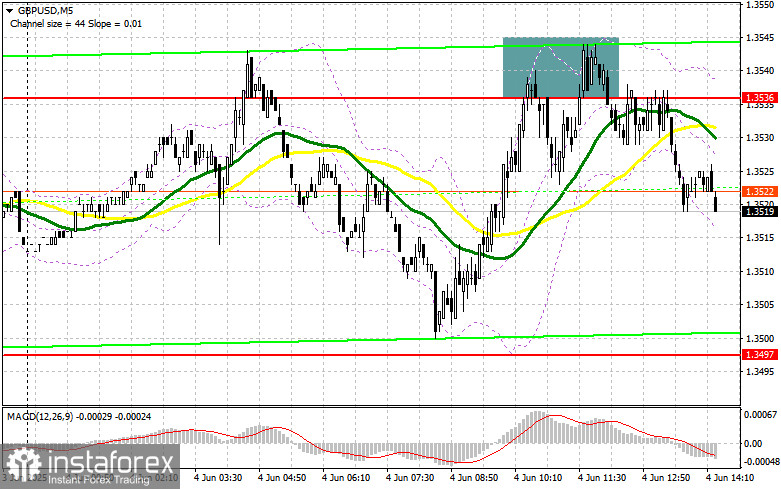
In my morning forecast, I focused on the 1.3536 level and planned to make trading decisions based on it. Let's take a look at the 5-minute chart and see what happened. A rise and formation of a false breakout around 1.3536 provided an entry point for selling the pound, resulting in a 15-point drop in the pair. The technical picture was not revised for the second half of the day.
To Open Long Positions on GBP/USD:
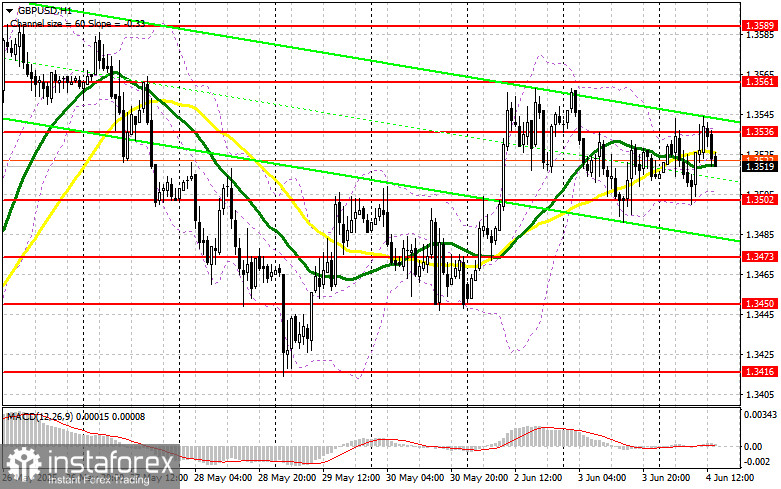
Service sector activity data for the U.K. for May was revised upward, sparking pound buying and dollar selling. However, a larger upward trend failed to materialize. It's clear that all eyes are now on the U.S. ADP labor market report and the PMI services and composite index data for May. In case of strong statistics, the pound will likely react with a decline. In that case, I prefer to act around the 1.3502 support. A false breakout there would provide a good entry point for long positions, aiming for a return to the 1.3536 resistance level, which failed to be broken in the first half of the day. A breakout and retest of this range from top to bottom would create a new entry point for long positions, targeting an update to 1.3561, which would bring back a bullish market. The ultimate target would be the 1.3589 level, where I plan to take profits.
If GBP/USD declines and there's no bullish activity around 1.3502 in the second half of the day, pressure on the pound could increase significantly. In that case, only a false breakout near 1.3473 would be a suitable condition for opening long positions. Otherwise, I plan to buy GBP/USD immediately on a rebound from 1.3450, targeting a 30–35 point intraday correction.
To Open Short Positions on GBP/USD:
Sellers are trying, but so far, no major sell-off has occurred — just defense of key levels. In the event of an upward spike in GBP/USD after the data, I plan to act only after a false breakout around the 1.3536 resistance. This would be sufficient for a sell entry point, targeting a drop to the 1.3502 support. A breakout and retest of this range from bottom to top would trigger stop-loss orders, opening the way to 1.3473. The ultimate target would be 1.3450, where I would take profits.
If demand for the pound persists in the second half of the day and the bears fail to assert themselves around 1.3536, where moving averages supporting the bears are located slightly below, it would be better to postpone selling until testing the 1.3561 resistance. I would only open short positions there after a false breakout. If there's no downward movement there either, I would look for short positions on a rebound around 1.3589, aiming for a 30–35 point downward correction.
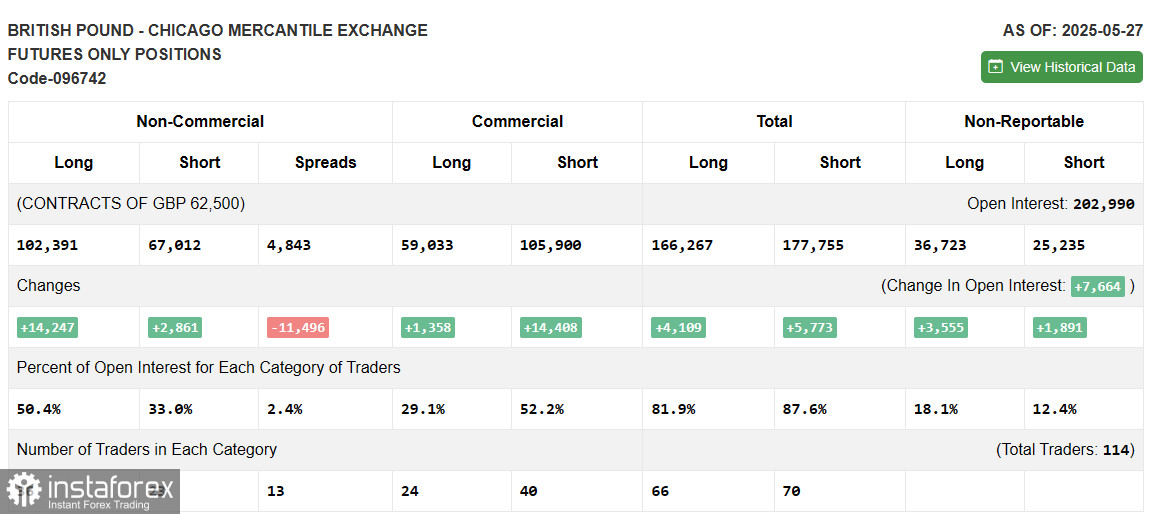
The COT (Commitments of Traders) report for May 27 showed a sharp increase in long positions and a less active rise in short positions. After the U.K. and the U.S. signed a trade agreement, demand for the pound remained stable. Considering that the Bank of England is staying on the sidelines and not interfering in monetary policy, the chances for further pound strengthening are fairly good. Add to this the renewed trade tensions between China and the U.S. and the weakness of the dollar, and it becomes clear that the medium-term bullish trend for the pound is not over. The latest COT report showed that long non-commercial positions rose by 14,247 to 102,391, while short non-commercial positions rose by 2,861 to 67,012, narrowing the gap between long and short positions by 11,469.
Indicator Signals:
Moving Averages:Trading is taking place around the 30- and 50-period moving averages, indicating market uncertainty.
Note: The period and prices of the moving averages are based on the author's analysis of the H1 chart and differ from the classical definition of daily moving averages on the D1 chart.
Bollinger Bands:In case of a decline, the lower boundary of the indicator around 1.3502 will act as support.
Indicator Descriptions:


