empty
23.01.2024 10:25 AM
EUR/USD and GBP/USD: trading tips for beginners on January 23

Details of economic calendar on January 22

The economic calendar commonly lacks high-impact economic data on Monday. Yesterday was no exception. The US, the UK, and the EU did not release any economic reports.

Analysis of technical charts on January 22

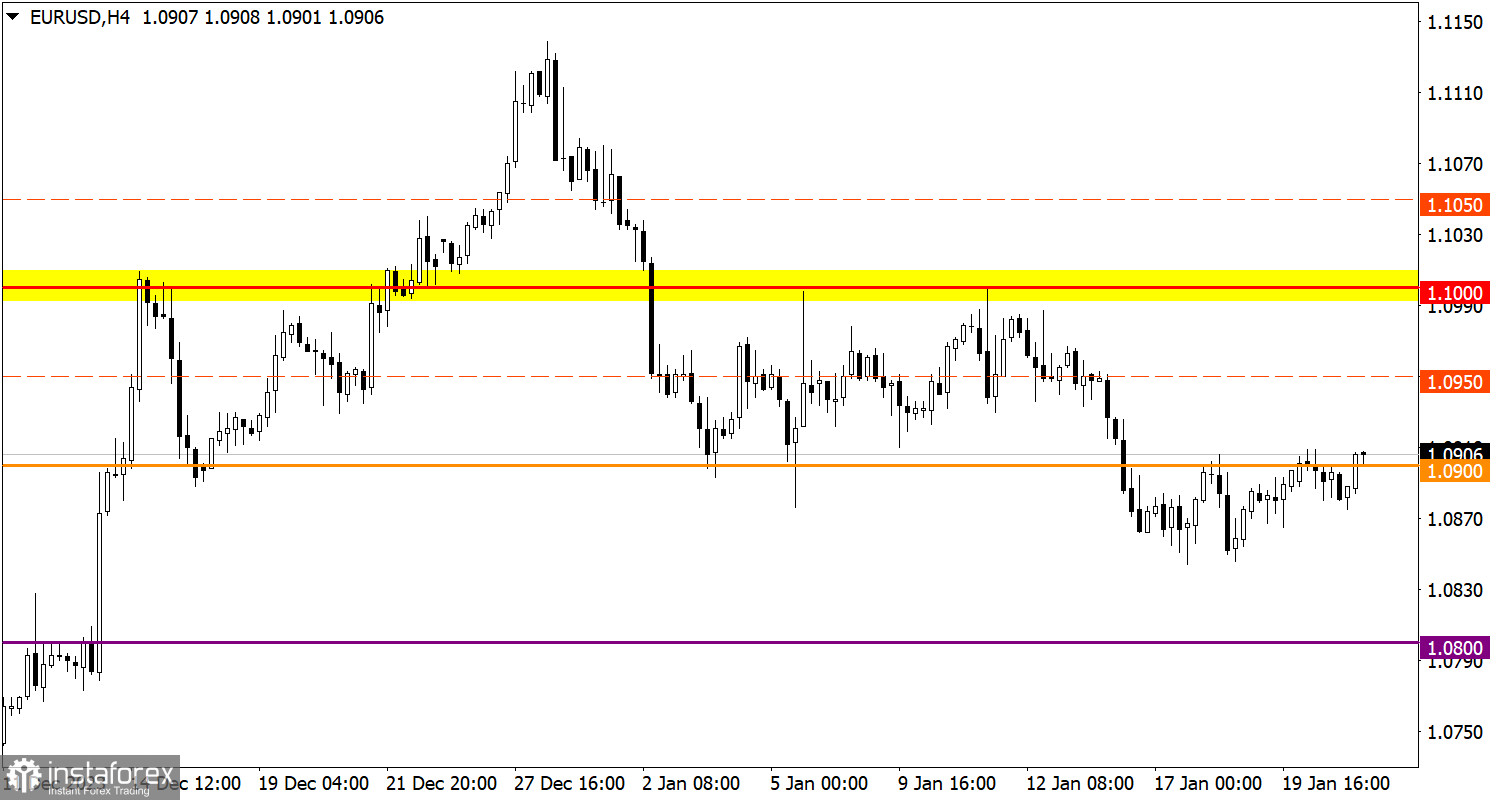
The EUR/USD pair has been moving around the 1.0900 level for the third day in a row with low trading activity. The level of 1.0850 serves as a variable support on the path of sellers. At this level, there was a reduction in short positions on EUR/USD.

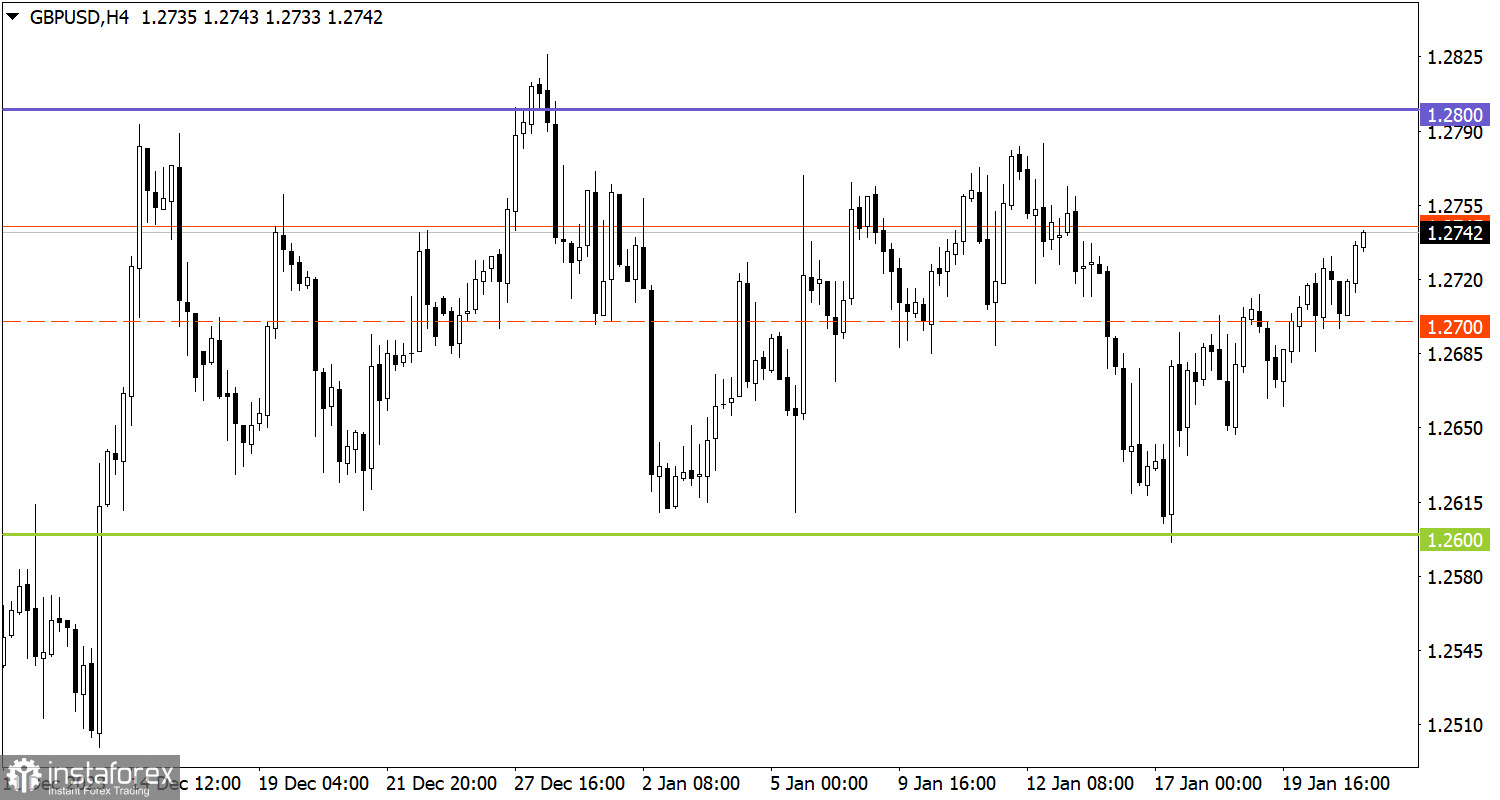
The GBP/USD currency pair is trading within the sideways channel of 1.2600/1.2800, consistently approaching the defined borders. At the moment, we see the consolidation above the average level of 1.2700, which indicates an increase in long positions on the range-bound market.

This image is no longer relevant

Economic calendar on January 23

Today the economic calendar is equally empty as on Monday. No macroeconomic data will be released in the US, the UK, and the EU.

Trading plan for EUR/USD on January 23

Consolidation of the price above 1.0900 during the day may lead to an increase in the volume of long positions in the direction towards 1.1000. As for the bearish scenario, it will come into play if the price drops below 1.0850.

This image is no longer relevant

Trading plan for GBP/USD on January 23

In this situation, we may go ahead trading within the borders of the sideways channel. We reckon the instrument could approach the upper border at 1.2800.

However, we should not forget that the range-bound market is a temporary pattern, which leads to the accumulation of trading forces and abundant attention from speculators. As a result, the instrument will gain a certain momentum and break any of the borders. When the flat market is over, the price will indicate a further direction in the market. For this reason, you should always consider the breakout strategy.

This image is no longer relevant

What's on charts

The candlestick chart type consists of graphic rectangles in white and black with lines at the top and bottom. With a detailed analysis of each individual candle, you can see its characteristics relative to a particular time frame: opening price, closing price, maximum and minimum price.

Horizontal levels are price coordinates relative to which a price may stop or revered its trajectory. In the market, these levels are called support and resistance.

Circles and rectangles are highlighted examples where the price developed. This color highlighting indicates horizontal lines that may put pressure on the price in the future.

Up/down arrows are guidelines for possible price direction in the future.

Recommended Stories

29 جولائی کو یورو/امریکی ڈالر کے جوڑے کی تجارت کیسے کی جائے؟ نئے افراد کے لیے آسان تجاویز اور تجارتی تجزیہ

پیر کی تجارت کا تجزیہ یورو/امریکی ڈالر کا 1گھنٹے کا چارٹ یورو/امریکی ڈالر کرنسی کا جوڑا کافی قابل فہم، منطقی، اور مستقل وجوہات کی بنا پر پیر کو ڈوب گیا۔

Paolo Greco 14:14 2025-07-29 UTC+2

29 جولائی کو برطانوی پاؤنڈ/امریکی ڈالر کے لیے تجارتی سفارشات اور تجارتی خرابی: پاؤنڈ کو وان ڈیر لیین سے اس کی توقع نہیں تھی

برطانوی پاؤنڈ/امریکی ڈالر کا 5 منٹ کا تجزیہ پیر کو برطانوی پاؤنڈ/امریکی ڈالر کرنسی کے جوڑے نے زیادہ سکون سے تجارت کی۔ یورپی تجارتی سیشن مکمل طور پر فلیٹ رینج

Paolo Greco 14:11 2025-07-29 UTC+2

29 جولائی کو یورو/امریکی ڈالر کے لیے تجارتی سفارشات اور تجارتی خرابی: یورو نے اپنے عزائم کو نقصان پہنچایا

یورو/امریکی ڈالر کا 5 منٹ کا تجزیہ پیر کو، یورو/امریکی ڈالر کرنسی کا جوڑا صرف ایک سرگرمی میں مصروف تھا — یہ گر رہا تھا۔ پچھلے چھ مہینوں میں،

Paolo Greco 14:10 2025-07-29 UTC+2

28 جولائی کو یورو/امریکی ڈالر کے جوڑے کی تجارت کیسے کی جائے؟ نئے افراد کے لیے آسان تجاویز اور تجارتی تجزیہ

جمعہ کی تجارت کا تجزیہ یورو/امریکی ڈالر کا 1گھنٹے کا چارٹ جمعہ کو، یورو/امریکی ڈالر کرنسی کے جوڑے نے کم سے کم کمی کے ساتھ تجارت کی۔ دن کے اختتام

Paolo Greco 13:56 2025-07-28 UTC+2

28 جولائی کو برطانوی پاؤنڈ/امریکی ڈالر کے لیے تجارتی سفارشات اور تجارتی خرابی: پاؤنڈ تیزی سے گرا لیکن اس کی رفتار نہیں کھوئی

برطانوی پاؤنڈ/امریکی ڈالر کا 5 منٹ کا تجزیہ جمعہ کو، برطانوی پاؤنڈ/امریکی ڈالر کرنسی کا جوڑا نیچے کے رجحان میں ٹریڈ کر رہا تھا۔ قیمت آسانی سے Senkou Span

Paolo Greco 13:30 2025-07-28 UTC+2

28 جولائی کو یورو/امریکی ڈالر کے لیے تجارتی سفارشات اور تجارتی خرابی: مثالی، مضبوط یورو

یورو/امریکی ڈالر کا 5 منٹ کا تجزیہ جمعہ کو، یورو/امریکی ڈالر کرنسی کے جوڑے نے ایک بار پھر کم اتار چڑھاؤ کے ساتھ تجارت کی لیکن تقریباً کامل تکنیکی رویے

Paolo Greco 13:29 2025-07-28 UTC+2

25 جولائی کو برطانوی پاؤنڈ/امریکی ڈالر کے لیے تجارتی سفارشات اور تجارتی خرابی: پاؤنڈ نے تصحیح کے لیے وقت تلاش کیا

برطانوی پاؤنڈ/امریکی ڈالر کا 5 منٹ کا تجزیہ جمعرات کو، برطانوی پاؤنڈ/امریکی ڈالر کرنسی کے جوڑے نے کم تجارت کی، جسے مقامی اصلاح سمجھا جا سکتا ہے۔ یہ حرکت

Paolo Greco 13:58 2025-07-25 UTC+2

25 جولائی کو یورو/امریکی ڈالر کے لیے تجارتی سفارشات اور تجارتی خرابی: مارکیٹ بے مقصد گھوم رہی ہے

یورو/امریکی ڈالر کا 5 منٹ کا تجزیہ جمعرات کو، یورو/امریکی ڈالر کرنسی کے جوڑے نے حیران کن طور پر کم اتار چڑھاؤ اور کسی بھی واضح سمت میں آگے بڑھنے

Paolo Greco 13:57 2025-07-25 UTC+2

How to Trade the GBP/USD Pair on July 24? Simple Tips and Trade Analysis for Beginners

Analysis of Wednesday's Trades 1H Chart of GBP/USD The GBP/USD pair also continued its upward movement on Wednesday. As expected, this happened without the need for any news or reports

Paolo Greco 14:41 2025-07-24 UTC+2

24 جولائی کو یورو/امریکی ڈالر کے جوڑے کی تجارت کیسے کی جائے؟ نئے افراد کے لیے آسان تجاویز اور تجارتی تجزیہ

بدھ کی تجارت کا تجزیہ یورو/امریکی ڈالر کا 1گھنٹے کا چارٹ بدھ کو، یورو/امریکی ڈالر کرنسی کے جوڑے نے اپنی اوپر کی حرکت جاری رکھی۔ بنیادی طور پر،

Paolo Greco 14:40 2025-07-24 UTC+2
ابھی فوری بات نہیں کرسکتے ؟
اپنا سوال پوچھیں بذریعہ چیٹ.
 

Dear visitor,

Your IP address shows that you are currently located in the USA. If you are a resident of the United States, you are prohibited from using the services of InstaFintech Group including online trading, online transfers, deposit/withdrawal of funds, etc.

If you think you are seeing this message by mistake and your location is not the US, kindly proceed to the website. Otherwise, you must leave the website in order to comply with government restrictions.

Why does your IP address show your location as the USA?

  • - you are using a VPN provided by a hosting company based in the United States;
  • - your IP does not have proper WHOIS records;
  • - an error occurred in the WHOIS geolocation database.

Please confirm whether you are a US resident or not by clicking the relevant button below. If you choose the wrong option, being a US resident, you will not be able to open an account with InstaTrade anyway.

We are sorry for any inconvenience caused by this message.