یہ بھی دیکھیں

 31.10.2022 11:20 AM
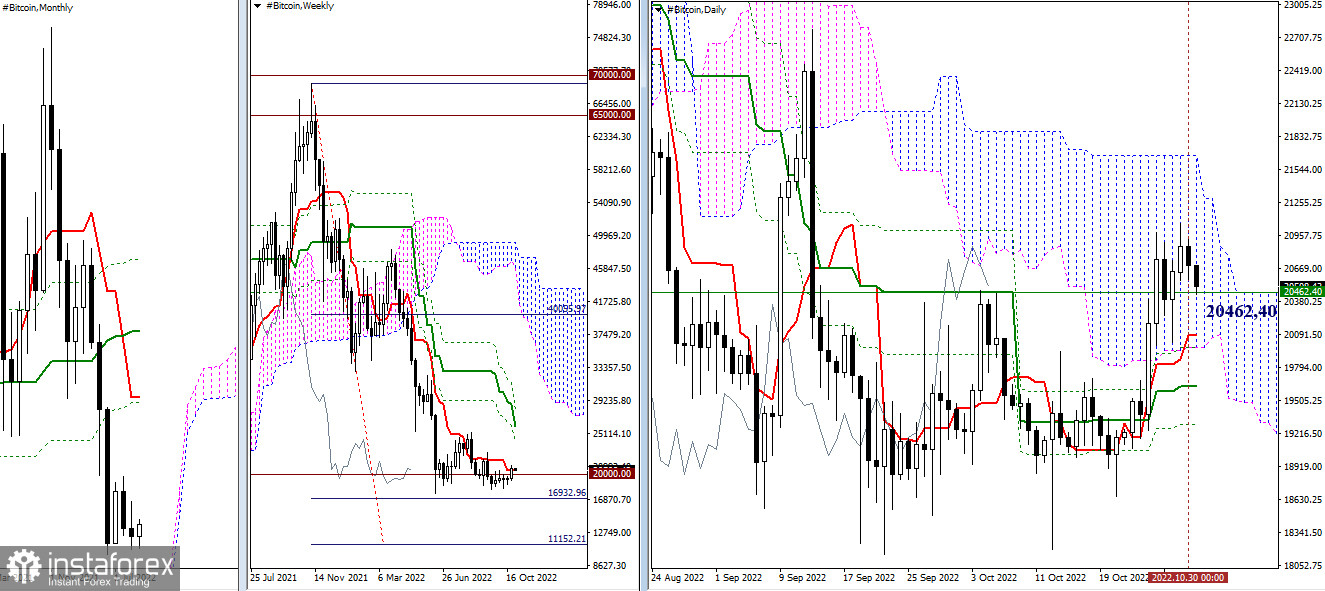
BITCOIN
Following a bull run to 65,000, BTC failed to reach 70,000 and went deep down. Amid the increased bearish activity, a reversal took place. Ichimoku crosses saw changes in the weekly and monthly time frames. In addition, the weekly Cloud was broken and a bearish target formed. The targets at 16933 and 11152 are now seen as important barriers for the downtrend to extend. However, bitcoin is currently consolidating around the psychological support level of 20,000. Should the bears push the price further down, the bulls consolidate above the weekly short-term trend (20,462.40) and BTC leave the daily Cloud and enter a bullish zone, the target would stand at 24,043.77. The price would hit the target in case of a breakout through the daily Ichimoku Cloud and the resistance of the weekly Cross.
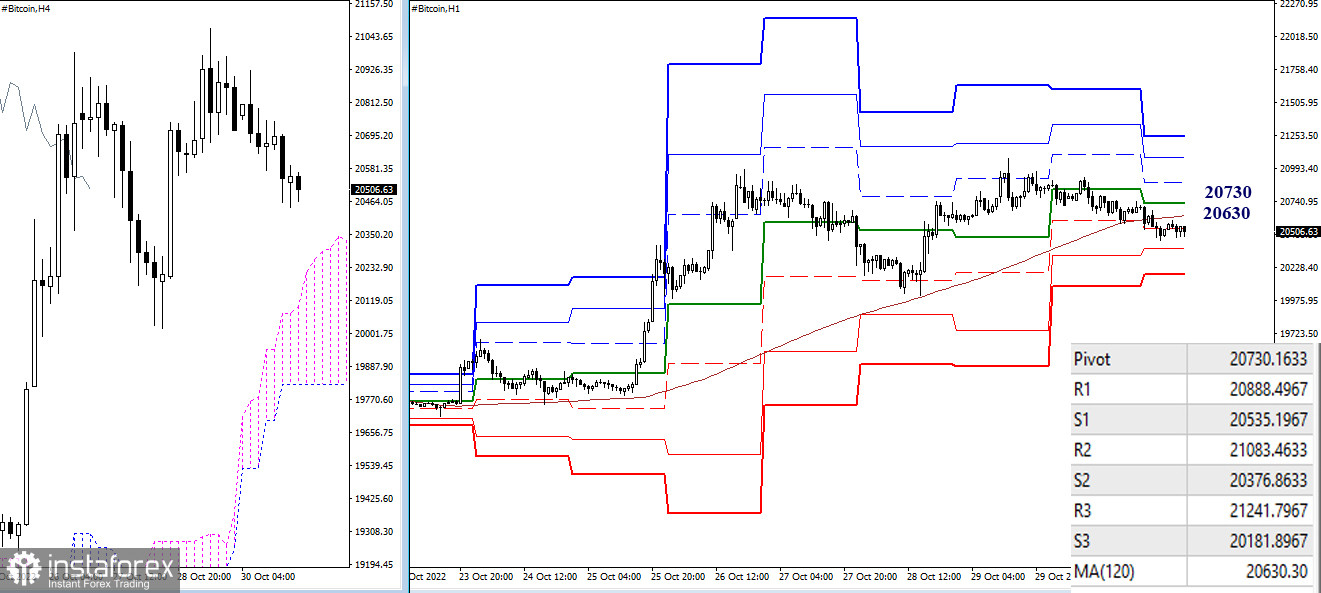
H4-H1
In the lower time frames, the downtrend is getting deeper. The bears are now active below the key levels of 20,630 – 20,730 (weekly long-term trend + central Pivot level). The downtrend would extend should bearish sentiment increase. The nearest intraday support levels are seen at 20,376.86 and 20,181.90 (classic Pivot levels). If BTC returns to the key levels of the lower time frames (20,630 – 20,730), the targets will stand at 20,888.50 – 21,083.46 – 21,241.80, in line with classic Pivot resistance.
***
Indicators used in technical analysis:
Higher time frames – Ichimoku Kinko Hyo (9.26.52) + Fibo Kijun
H1 – Pivot Points (classic) + Moving Average (120) (weekly long-term trend)
You have already liked this post today
*تعینات کیا مراد ہے مارکیٹ کے تجزیات یہاں ارسال کیے جاتے ہیں جس کا مقصد آپ کی بیداری بڑھانا ہے، لیکن تجارت کرنے کے لئے ہدایات دینا نہیں.


