Бычий флаг
сформирован 29.05 в 22:16:27 (UTC+0)
сила сигнала 3 из 5

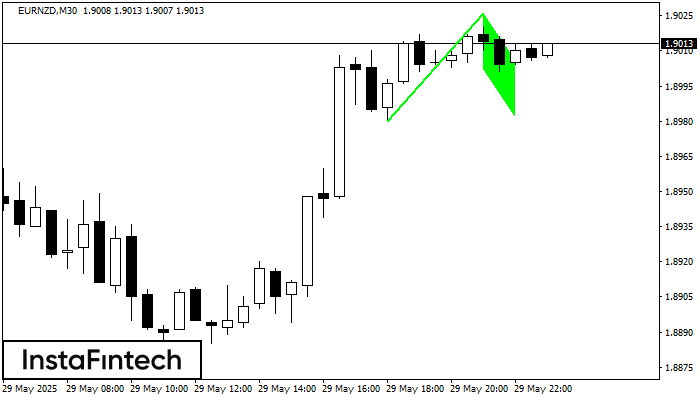
На графике EURNZD M30 сформировалась фигура продолжения тренда «Бычий флаг». Прогноз: Фиксация цены выше максимума фигуры 1.9026 предоставит трейдеру возможность открыть длинную позицию на покупку до уровня 1.9056.
Шунингдек кўринг
- Все
- Все
- Bearish Rectangle
- Bearish Symmetrical Triangle
- Bullish Rectangle
- Double Top
- Double Top
- Triple Bottom
- Triple Bottom
- Triple Top
- Triple Top
- Все
- Все
- Покупка
- Продажа
- Все
- 1
- 2
- 3
- 4
- 5
Double Bottom
was formed on 01.08 at 08:30:10 (UTC+0)
signal strength 2 of 5
The Double Bottom pattern has been formed on NZDCAD M15; the upper boundary is 0.8145; the lower boundary is 0.8138. The width of the pattern is 6 points. In case
The M5 and M15 time frames may have more false entry points.
Open chart in a new window
Double Bottom
was formed on 01.08 at 08:30:05 (UTC+0)
signal strength 1 of 5
The Double Bottom pattern has been formed on GBPJPY M5. Characteristics: the support level 198.59; the resistance level 198.72; the width of the pattern 13 points. If the resistance level
The M5 and M15 time frames may have more false entry points.
Open chart in a new window
Bearish Symmetrical Triangle
was formed on 01.08 at 07:46:26 (UTC+0)
signal strength 3 of 5
According to the chart of M30, NZDCHF formed the Bearish Symmetrical Triangle pattern. Trading recommendations: A breach of the lower border 0.4776 is likely to encourage a continuation
Open chart in a new window