
यह भी देखें


 24.09.2026 05:37 AM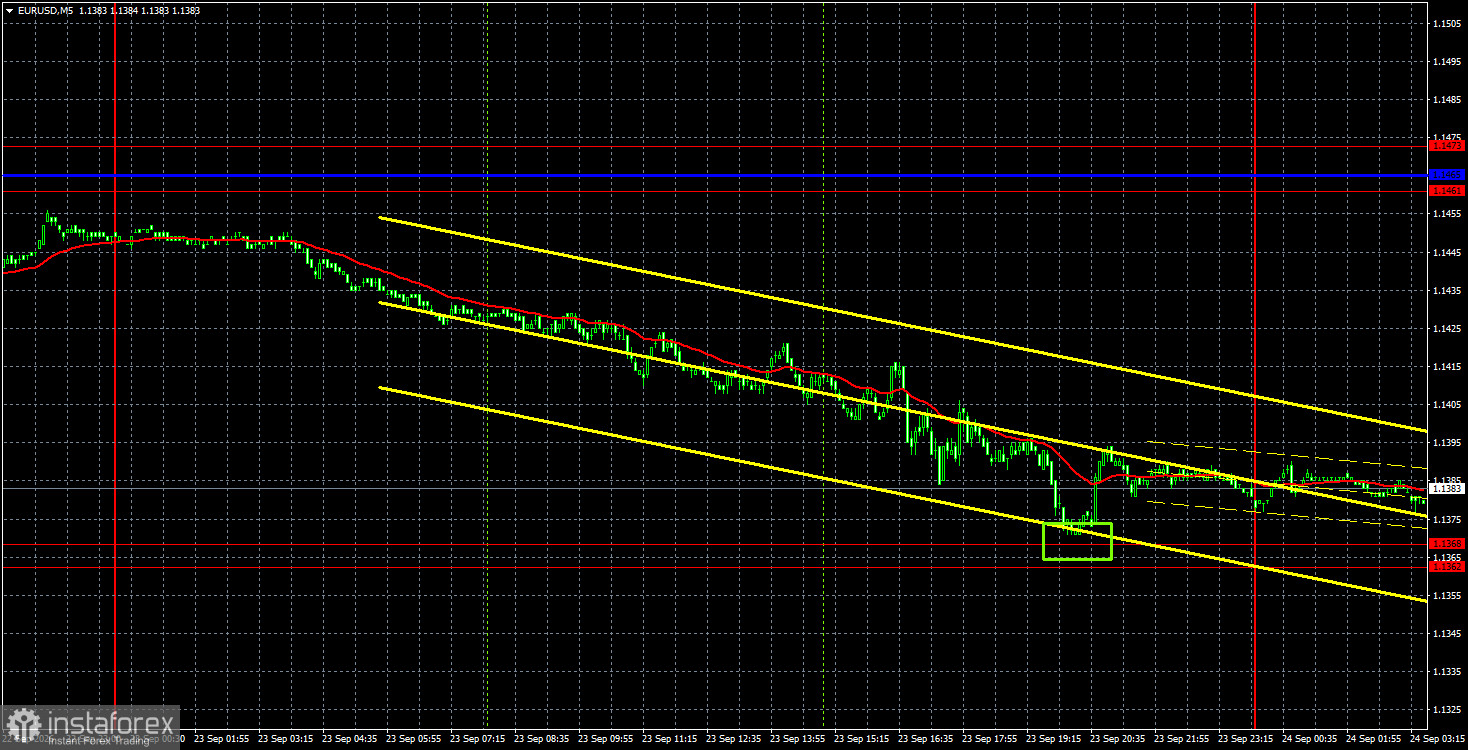
The EUR/USD pair continued its downward movement throughout Wednesday. Recently, we repeatedly pointed out to traders that the dollar has only one supporting factor, while the market ignores all other factors. This week, we can already say with confidence that the pair's current decline has nothing to do with "logic" or "justification." The euro has been falling virtually every day, and the market pays no attention to local events or macroeconomic releases. Yesterday, for example, fairly decent business activity indices for services and manufacturing were released in the EU and Germany and came in above forecasts. As a result, the euro fell all day. Thus, fundamentals, geopolitics, and macroeconomics are not influencing market sentiment now. We continue to see illogical, inertial movement to the south. Trading now is possible only by technical levels, lines, and areas.
Technically, the downward trend continues to form. The market once again ignored the European Central Bank's "hawkish" decision, but it has reacted with "triple" force to the Federal Reserve's rate hikes and continues to react to them — in September and the future. The flat ended, the pair broke an important support area, the trend line remains relevant, and the price is located below the Ichimoku indicator lines. Technically, the current decline is fully consistent — but only on the hourly TF.
On the 5-minute TF on Wednesday, one buy trading signal formed as a rebound from the 1.1362–1.1368 area. However, recall that a day earlier two sell trading signals were formed in the 1.1461–1.1473 area, which traders, given the current market specifics, could carry into Wednesday. As a result, those signals allowed obtaining a profit of 70 pips.
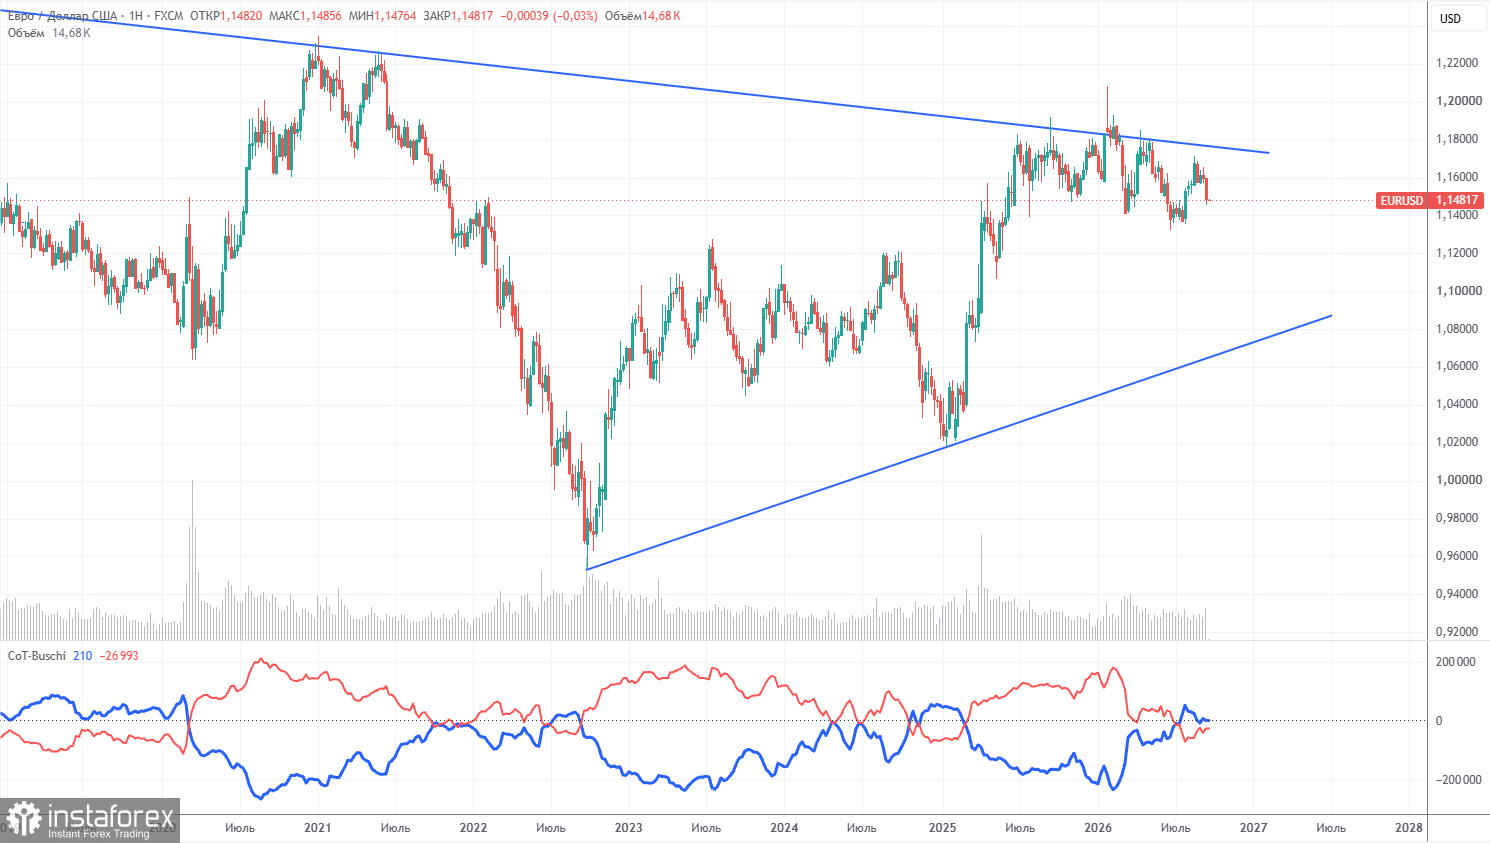
The latest COT report is dated September 15. On the weekly timeframe, it is clear that non-commercial traders' net position remains bearish and has fallen sharply in 2026 amid geopolitical events. Traders have been reducing euro exposure in favor of the US dollar over the past six months. Trump's policy has not changed, but the dollar acted as a reserve currency for a period.
However, we still do not see fundamental factors for further USD strength. The Middle East war made the dollar temporarily super-attractive, but when that factor's "shelf life" expires, everything should return to normal — and that shelf life may already have expired. In the long term, the euro could fall as low as $1.08 (trend line), but the long-term uptrend remains intact. During recent months of dollar strength, the pair has not come close to that trend line.
The placement of the red and blue indicator lines indicates approximate parity between bulls and bears. During the last reporting week, long positions in the "Non-commercial" group rose by 10,500 contracts while shorts fell by 5,100. Accordingly, the net position increased by 15,600 contracts for the week.
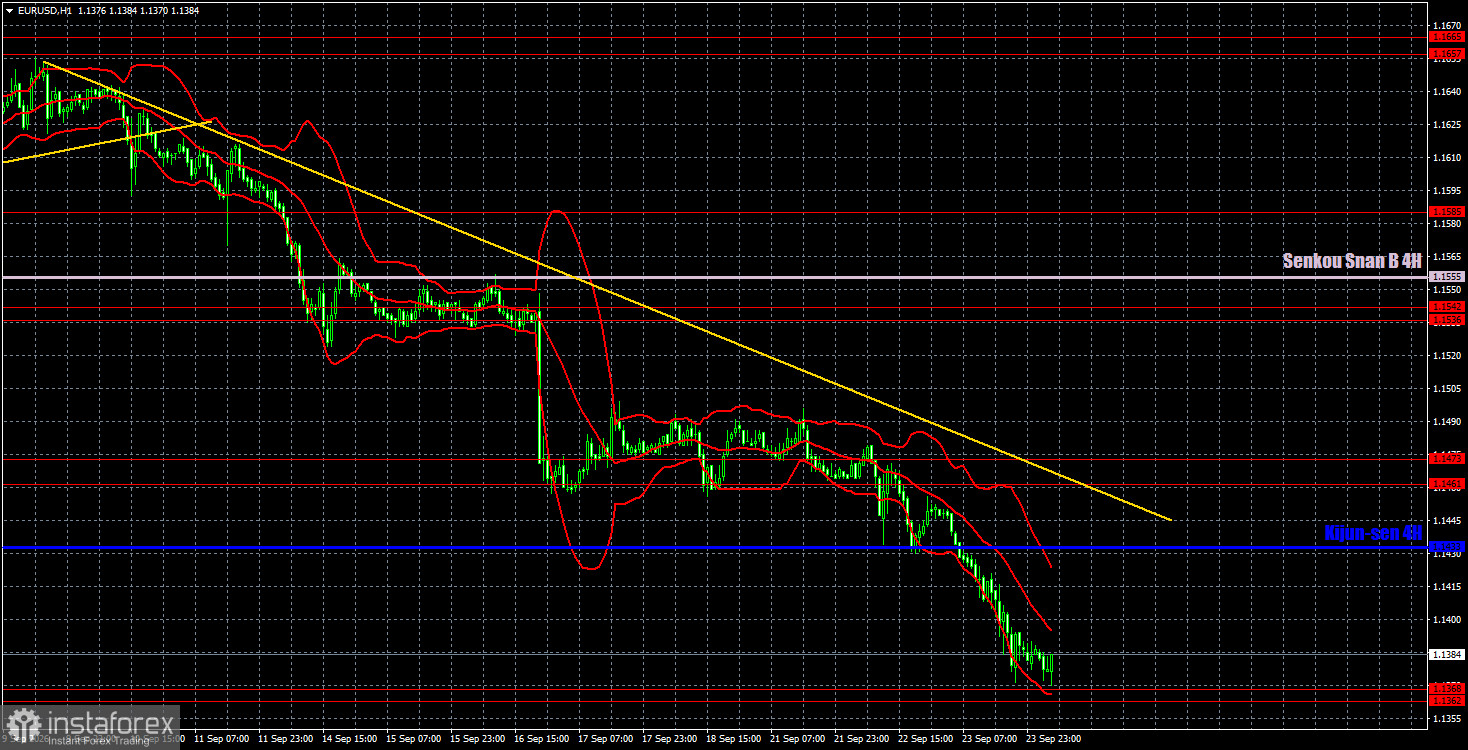
On the hourly timeframe, EUR/USD continues to form a downward trend, and the Fed has strongly contributed to the southbound move. The ECB should have supported the euro by raising rates for the second time in 2026, but the market now sees only the Fed and its tightening. Thus,the dollar has effectively formed an entire trend out of nowhere, and market sentiment may remain "bearish."
For September 24 we highlight the following levels for trading — 1.1234, 1.1274, 1.1362–1.1368, 1.1461–1.1473, 1.1536–1.1542, 1.1585, 1.1657–1.1665, 1.1750–1.1760, as well as the Senkou Span B line (1.1555) and the Kijun-sen (1.1433). The Ichimoku indicator lines may shift during the day, which should be taken into account when determining trading signals. Don't forget to move the Stop Loss to breakeven if the price moves 15 pips in the correct direction. This will protect against possible losses if the signal proves false.
On Thursday, the economic calendars in the EU and the US contain no important entries, and the market continues to ignore any fundamental and macroeconomic events. Thus, the pair's movements now depend on neither news nor events.
Today, traders can open new short positions targeting 1.1274 if price consolidates below the 1.1362–1.1368 area. Consider long positions on a rebound from the 1.1362–1.1368 area, targeting 1.1433 and 1.1461–1.1473.
Support and resistance price levels are thick red lines where movement may conclude. They are not sources of trading signals.
The Kijun-sen and Senkou Span B lines are Ichimoku indicator lines transferred to the hourly timeframe from the 4-hour timeframe. They are strong lines.
Extreme levels are thin red lines from which the price has previously rebounded. They are sources of trading signals.
Yellow lines indicate trend lines, trending channels, and any other technical patterns.
Indicator 1 on COT charts shows the size of the net position of each category of traders.

