Triple Bottom
was formed on 20.06 at 07:30:07 (UTC+0)
signal strength 3 of 5

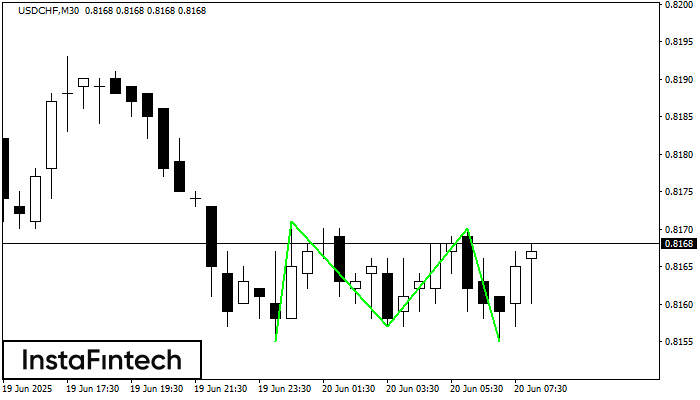
The Triple Bottom pattern has been formed on USDCHF M30. It has the following characteristics: resistance level 0.8171/0.8170; support level 0.8155/0.8155; the width is 16 points. In the event of a breakdown of the resistance level of 0.8171, the price is likely to continue an upward movement at least to 0.8187.
Lihat juga
- All
- All
- Bearish Rectangle
- Bearish Symmetrical Triangle
- Bullish Rectangle
- Double Top
- Double Top
- Triple Bottom
- Triple Bottom
- Triple Top
- Triple Top
- All
- All
- Buy
- Sale
- All
- 1
- 2
- 3
- 4
- 5
รูปแบบกราฟธงปลายแหลมขาลง (Bearish pennant)
was formed on 11.07 at 21:00:55 (UTC+0)
signal strength 3 of 5
รูปแบบ รูปแบบกราฟธงปลายแหลมขาลง (Bearish pennant) ได้สร้างขึ้นมาในชาร์ต #NTDOY M30 รูปแบบนี้แสดงถึงความต่องเนื่องของแนวโน้มขาลง กรณีที่มีการเคลื่อนตัวทะลุผ่านของระดับต่ำในรูปธงปลายแหลมที่ 21.38 ออกไป คำแนะนำ: กำหนดคำสั่งซื้อขายล่วงหน้า(pending order)
Open chart in a new window
รูปแบบกราฟธงปลายแหลมขาลง (Bearish pennant)
was formed on 11.07 at 21:00:32 (UTC+0)
signal strength 3 of 5
รูปแบบ รูปแบบกราฟธงปลายแหลมขาลง (Bearish pennant) ได้สร้างขึ้นมาในชาร์ต #NTDOY M30 รูปแบบนี้แสดงถึงความต่องเนื่องของแนวโน้มขาลง กรณีที่มีการเคลื่อนตัวทะลุผ่านของระดับต่ำในรูปธงปลายแหลมที่ 21.38 ออกไป คำแนะนำ: กำหนดคำสั่งซื้อขายล่วงหน้า(pending order)
Open chart in a new window
รูปแบบกราฟจุดสองยอด (Double Top)
was formed on 11.07 at 20:00:15 (UTC+0)
signal strength 2 of 5
ในชาร์ตของ #TSLA M15 พบว่า กราฟรูปแบบย้อนกลับ รูปแบบกราฟจุดสองยอด (Double Top) ได้ถูกสร้างขึ้นมา คุณลักษณะ: ขอบเขตด้านบน 311.31; ขอบเขตด้านล่าง 306.40; ความกว้างของกราฟรูปแบบนี้คือ
ขอบเตระยะเวลาใน M5 และ M15 อาจจะมีตำแหน่งการเข้าใช้งานที่ผิดพลาดมากยิ่งขึ้น
Open chart in a new window