Triple Top
was formed on 06.06 at 22:00:38 (UTC+0)
signal strength 1 of 5
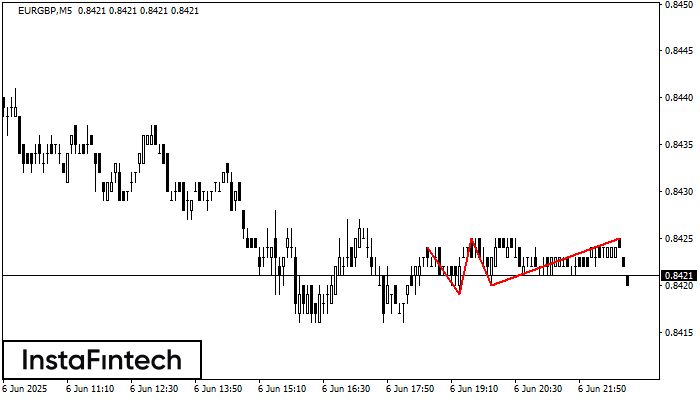
On the chart of the EURGBP M5 trading instrument, the Triple Top pattern that signals a trend change has formed. It is possible that after formation of the third peak, the price will try to break through the resistance level 0.8419, where we advise to open a trading position for sale. Take profit is the projection of the pattern’s width, which is 5 points.
The M5 and M15 time frames may have more false entry points.
Lihat juga
- All
- All
- Bearish Rectangle
- Bearish Symmetrical Triangle
- Bullish Rectangle
- Double Top
- Double Top
- Triple Bottom
- Triple Bottom
- Triple Top
- Triple Top
- All
- All
- Buy
- Sale
- All
- 1
- 2
- 3
- 4
- 5
ডাবল বটম
was formed on 08.08 at 22:31:28 (UTC+0)
signal strength 1 of 5
M5 চার্টে, NZDUSD-এর ডাবল বটম প্যাটার্নটি গঠিত হয়েছে। উপরের সীমানা হল 0.5947; নীচের সীমানা হল 0.5942। প্যাটার্নের প্রস্থ হল 5 পয়েন্ট। 0.5947-এর উপরের সীমানা ভেদ করার ক্ষেত্রে, প্রবণতা পরিবর্তনের পূর্বাভাস
M5 এবং M15 টাইম ফ্রেমে আরও ভুল এন্ট্রি পয়েন্ট থাকতে পারে।
Open chart in a new window
ডাবল টপ
was formed on 08.08 at 21:30:13 (UTC+0)
signal strength 3 of 5
M30 চার্টে, AUDUSD-এর ডাবল টপ প্যাটার্নটি গঠিত হয়েছে। এটি এই ইঙ্গিত দেয় যে চলমান প্রবণতা ঊর্ধ্বমুখী থেকে নিম্নমুখীতে পরিবর্তিত হয়েছে। সম্ভবত, যদি 0.6523 প্যাটার্নের ভিত্তিটি ব্রেক করা হয়, তাহলে নিম্নমুখী
Open chart in a new window
বুলিশ পেন্যান্ট
was formed on 08.08 at 21:12:19 (UTC+0)
signal strength 3 of 5
M30 চার্টে, #TSLA-এ বুলিশ পেন্যান্ট প্যাটার্নটি গঠিত হয়েছে। এটি এক ধরনের ধারাবাহিকতার প্যাটার্ন। অনুমিতভাবে, যদি মূল্য পেন্যান্টের সর্বোচ্চ 334.72 -এর উপরে স্থির হয়, তাহলে আরও ঊর্ধ্বমুখী প্রবণতার সম্ভবনা রয়েছে।
Open chart in a new window