Bearish Symmetrical Triangle
was formed on 05.06 at 00:31:51 (UTC+0)
signal strength 3 of 5
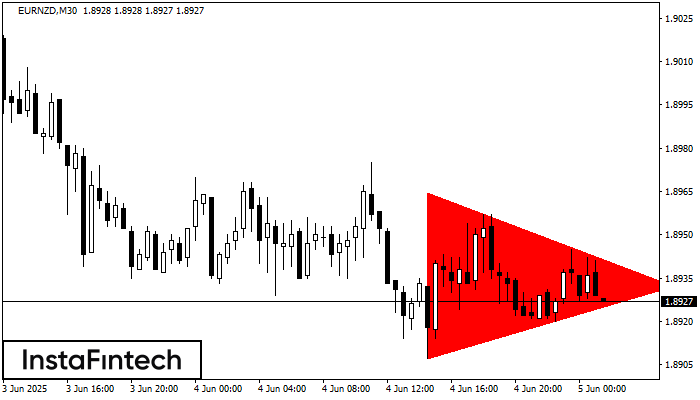
According to the chart of M30, EURNZD formed the Bearish Symmetrical Triangle pattern. Description: The lower border is 1.8907/1.8932 and upper border is 1.8965/1.8932. The pattern width is measured on the chart at -58 pips. The formation of the Bearish Symmetrical Triangle pattern evidently signals a continuation of the downward trend. In other words, if the scenario comes true and EURNZD breaches the lower border, the price could continue its move toward 1.8902.
Lihat juga
- All
- All
- Bearish Rectangle
- Bearish Symmetrical Triangle
- Bullish Rectangle
- Double Top
- Double Top
- Triple Bottom
- Triple Bottom
- Triple Top
- Triple Top
- All
- All
- Buy
- Sale
- All
- 1
- 2
- 3
- 4
- 5
Bawah Triple
was formed on 20.08 at 14:31:18 (UTC+0)
signal strength 2 of 5
Pola Bawah Triple telah terbentuk pada grafik NZDUSD M15. Fitur-fitur pola: garis bawah pola memiliki koordinat 0.5833 dengan batas atas 0.5833/0.5827, proyeksi lebar adalah 18 poin. Pembentukan pola Bawah Triple
Rangka waktu M5 dan M15 mungkin memiliki lebih dari titik entri yang keliru.
Open chart in a new window
Kepala dan Bahu Terbalik
was formed on 20.08 at 14:31:13 (UTC+0)
signal strength 2 of 5
Menurut grafik M15, NZDUSD menghasilkan pola yang disebut Kepala dan Bahu Terbalik. The Head ditetapkan di 0.5810 sementara garis median The Neck ditetapkan di 0.5830/0.5827. Formasi Pola Kepala dan Bahu
Rangka waktu M5 dan M15 mungkin memiliki lebih dari titik entri yang keliru.
Open chart in a new window
Bawah Triple
was formed on 20.08 at 14:31:13 (UTC+0)
signal strength 3 of 5
Pola Bawah Triple telah terbentuk pada grafik instrumen trading NZDUSD M30. Pola tersebut menandakan perubahan dalam trend dari menurun menjadi naik jika terjadi pemecahan (breakdown) 0.5833/0.5827
Open chart in a new window