Lihat juga
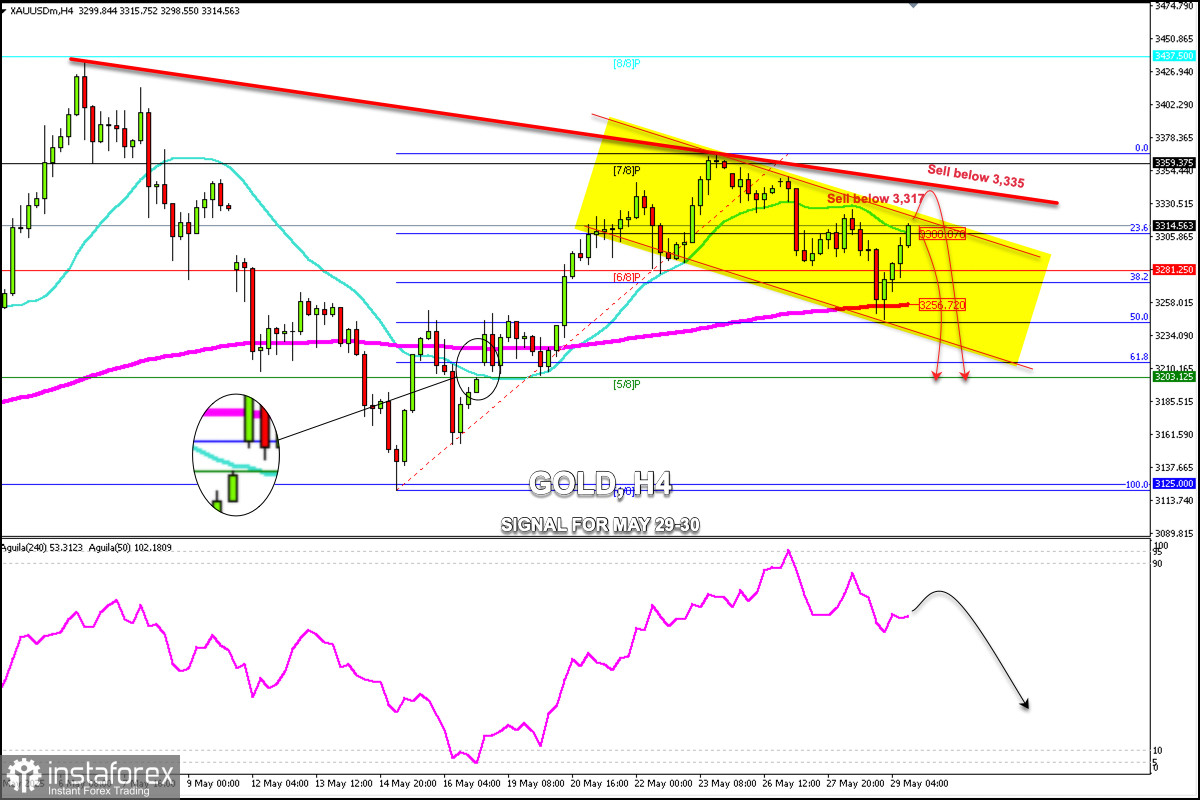
Early in the American session, gold is trading around 3,314 with a strong technical rebound originating after reaching the 50% Fibonacci retracement. Gold rose sharply after testing the 200 EMA support located at 3,256.
Gold could continue rising in the coming hours but should break the top of the downtrend channel around 3,317. If this scenario occurs, it could continue to reach the top of the main downtrend channel around 3,335.
Should gold fail to break above and break below 3,317, this could be seen as an opportunity to sell, as a technical correction could be expected. Gold could reach 6/8 Murray at 3,281, and could even cover the gap it left on May 16, around 3,198.
Technically, gold is seen as overbought, however, a technical correction is likely in the coming hours, and this could be seen as an opportunity to sell below 3,335.
You have already liked this post today
*Analisis pasar yang diposting disini dimaksudkan untuk meningkatkan pengetahuan Anda namun tidak untuk memberi instruksi trading.
Pada grafik per jam, pasangan GBP/USD sempat berkonsolidasi di bawah zona support 1,3425–1,3444, yang mengisyaratkan potensi kelanjutan penurunan pada pound sterling. Namun, setelah pertemuan Bank of England, tekanan beli kembali
Meski di chart hariannya indeks Nasdaq 100 nampak bergerak diatas WMA (30 Shift 2) yang memiliki kemiringan menukik keatas, namun dengan tertahannya di level area Resistance 22105,2-21891,3 ditambah dengan munculnya
Dengan pergerakan harga EUR/GBP pada chart 4 jamnya yang bergerak diatas WMA (21) yang memiliki kemiringan menukik keatas serta munculnya konvergensi antara pergerakan harga EUR/GBP dengan indikator Stochastic Oscillator, memberi
Instrumen Komoditi Perak di chart 4 jamnya nampak masih bergerak didalam bias Bullishnya dimana hal ini terkonfirmasi oleh WMA (21) yang memiliki kemiringan menukik naik keatas dan pergerakan harga Perak
Dengan munculnya Divergensi antara pergerakan harga AUD/JPY dengan indikator Stochastic Oscillator pada chart 4 jamnya serta posisi harga yang masih berada diatas WMA (21) yang memiliki kemiringan menukik naik, maka
Your IP address shows that you are currently located in the USA. If you are a resident of the United States, you are prohibited from using the services of InstaFintech Group including online trading, online transfers, deposit/withdrawal of funds, etc.
If you think you are seeing this message by mistake and your location is not the US, kindly proceed to the website. Otherwise, you must leave the website in order to comply with government restrictions.
Why does your IP address show your location as the USA?
Please confirm whether you are a US resident or not by clicking the relevant button below. If you choose the wrong option, being a US resident, you will not be able to open an account with InstaTrade anyway.
We are sorry for any inconvenience caused by this message.