empty
15.05.2023 09:50 AM
Technical analysis on Silver for May 12th, 2023.

This image is no longer relevant

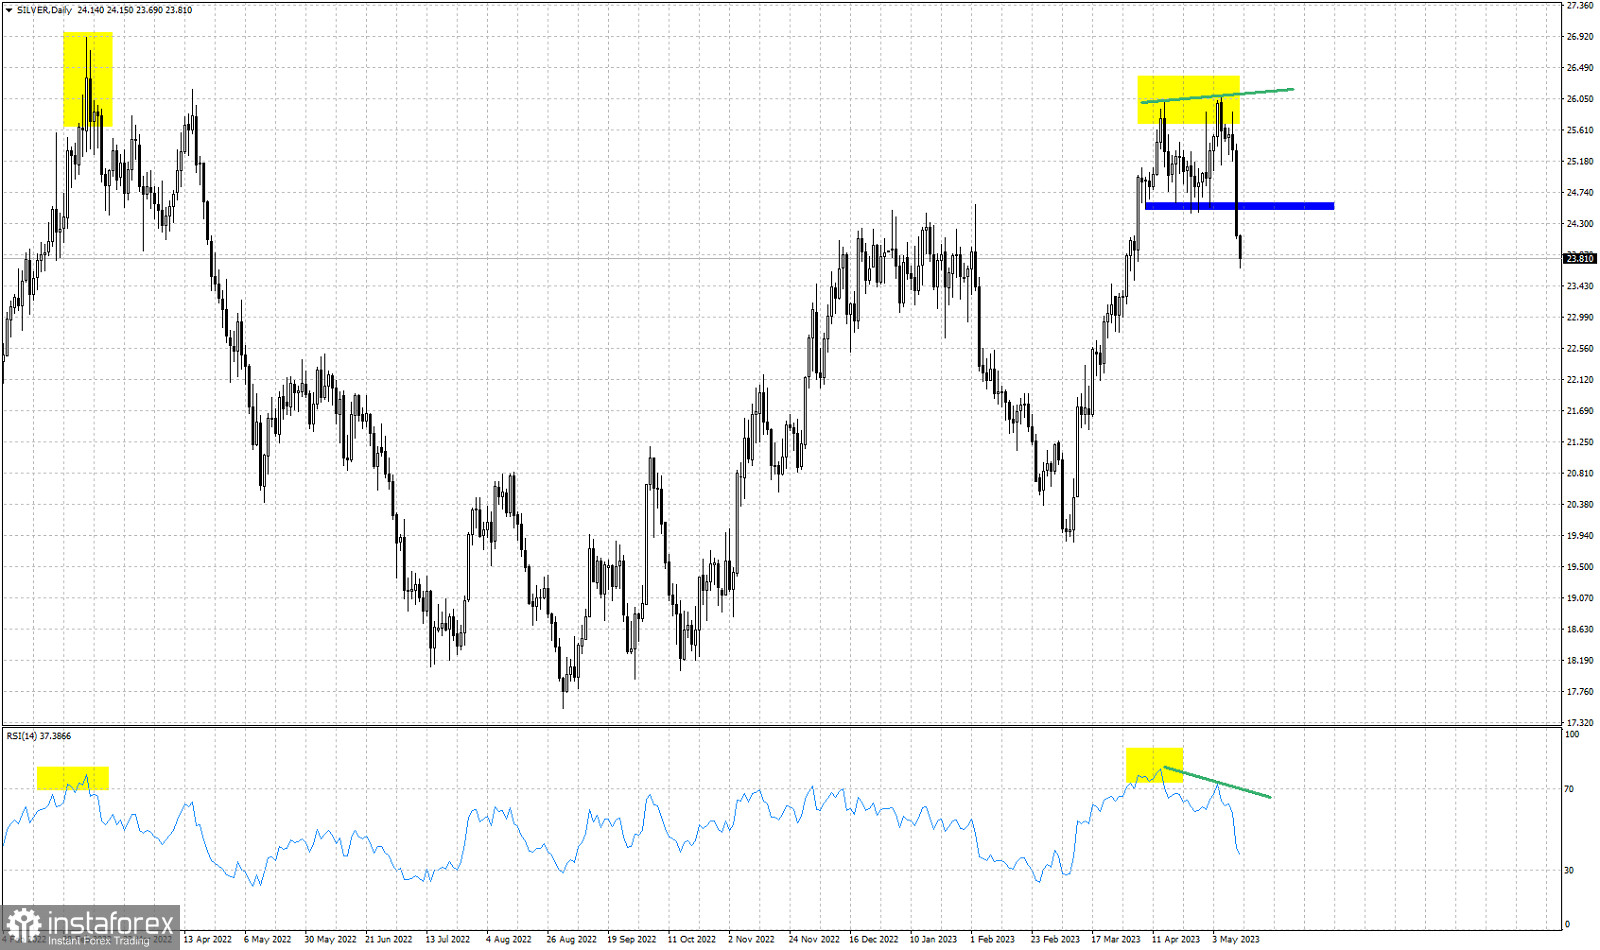
Yellow rectangles- overbought tops

Blue rectangle- key support

Green lines- bearish divergence in the RSI

Our analysis on Silver on May 5th explained the scenario of an important top and the chances of a bearish reversal in trend. Price was then trading around $25.60-$26 and is now falling below $24. The similarities to the previous top on February of 2022 have led us to expect a decline. We see now that history repeats as the similar technical conditions in Silver have the same result. The RSI reached similar overbought levels with February of 2022. The RSI provided a bearish divergence warning. Price is now under pressure as expected and is making lower lows and lower highs. We are in a corrective phase with Silver price approaching the 38% Fibonacci retracement of the entire rise from $19.85. Next key support is at $22.92 where we find the 50% Fibonacci retracement. The RSI is far from oversold levels so we continue to expect price to move even lower.

Recommended Stories

Indeks Nasdaq 100 berpotensi menguji level Resistance terdekatnya, Kamis 03 Juli 2025.

Indeks Nasdaq 100, Kamis 03 Juli 2025. Laporan keuangan Big Tech Company yang positif serta kebijakan Dovish The Fed yang rumornya semakin kuat serta maraknya inovasi AI membuat sentimen positif

Arief Makmur 06:17 2025-07-03 UTC+2

Prediksi Perak untuk 3 Juli 2025

Setelah perjuangan sengit selama dua hari (Senin dan Selasa) antara bull dan bear di sepanjang garis channel harga di tengah peningkatan volatilitas, kemarin kita melihat hasilnya — bull menang, mendorong

Laurie Bailey 05:11 2025-07-03 UTC+2

Sinyal Trading untuk EUR/USD pada 2-5 Juli 2025: jual di bawah 1,1840 (+1/8 Murray - 21 SMA)

Jika euro menembus di bawah 1,1762 dan berkonsolidasi di bawah zona harga ini, laju bearish kemungkinan akan terjadi dan dapat mencapai dasar saluran tren sekitar 1,1620. Pada akhirnya, ini bisa

Dimitrios Zappas 19:00 2025-07-02 UTC+2

Sinyal Trading untuk EMAS (XAU/USD) pada 2-8 Juli 2025: beli di atas 3,325 (21 SMA - 200 EMA)

Emas mungkin sedang bersiap untuk memulai rangkaian kenaikan baru, sehingga ketika harga terkonsolidasi di atas 3,325 atau 3,312, setiap rebound teknis akan dianggap sebagai sinyal beli, dengan target jangka pendek

Dimitrios Zappas 18:58 2025-07-02 UTC+2

USD/JPY. Analisis, Prakiraan, dan Situasi Pasar Saat Ini

Oscillator negatif pada grafik 4 jam menunjukkan bahwa pergerakan naik lebih lanjut dapat dianggap sebagai peluang untuk menjual. Dari sudut pandang teknikal, keberadaan oscilator negatif pada grafik 4 jam menunjukkan

Irina Yanina 18:48 2025-07-02 UTC+2

Prediksi untuk EUR/USD pada 2 Juli 2025

Pada hari Selasa, pasangan EUR/USD melakukan upaya yang tidak berhasil untuk mengkonsolidasikan di atas level 1.1802. Hari ini, pemantulan dari level ini akan menguntungkan dolar AS dan penurunan menuju level

Samir Klishi 11:07 2025-07-02 UTC+2

Prediksi untuk GBP/USD pada 2 Juli 2025

Pada grafik per jam, pasangan GBP/USD terus naik pada hari Selasa, meskipun para bull sedikit mundur, yang memungkinkan pasangan ini untuk berkonsolidasi di bawah level korektif 200,0% di 1,3749. Namun

Samir Klishi 11:00 2025-07-02 UTC+2

Meskipun EUR/GBP berpotensi terkoreksi tetapi ada peluang untuk kembali menguat, Rabu 02 Juli 2025.

EUR/GBP – Rabu, 02 Juli 2025 EUR/GBP berpotensi menguat karena kebijakan ECB yang memberi sinyal kebijakan dovish-nya sudah hampir selesai, sebaliknya kebijakan Dovish BoE justru terus berlanjut sehingga berpotensi melemahkan

Arief Makmur 07:08 2025-07-02 UTC+2

Mampukah AUD/USD menguji level Resistance terdekatnya, Rabu 02 Juli 2025.

AUD/USD – Rabu, 2 Juli, 2025 Pasangan Mata Uang AUD/USD terdorong menguat naik oleh karena pelemahan Greenback akibat ketidak-pastian perang tarif serta dorongan agar the Fed menurunkan suku bunganya Level-Level

Arief Makmur 07:05 2025-07-02 UTC+2

Prediksi EUR/USD untuk 2 Juli 2025

Jadi, kutipan euro telah mencapai titik X. Kemarin malam pada grafik mingguan, harga menyentuh batas atas saluran harga, sebuah sinar Fibonacci, dan semua ini terjadi pada akhir batas waktu Fibonacci

Laurie Bailey 05:12 2025-07-02 UTC+2
Tidak bisa bicara sekarang?
Tanyakan pertanyaan anda lewat chat.
 

Dear visitor,

Your IP address shows that you are currently located in the USA. If you are a resident of the United States, you are prohibited from using the services of InstaFintech Group including online trading, online transfers, deposit/withdrawal of funds, etc.

If you think you are seeing this message by mistake and your location is not the US, kindly proceed to the website. Otherwise, you must leave the website in order to comply with government restrictions.

Why does your IP address show your location as the USA?

  • - you are using a VPN provided by a hosting company based in the United States;
  • - your IP does not have proper WHOIS records;
  • - an error occurred in the WHOIS geolocation database.

Please confirm whether you are a US resident or not by clicking the relevant button below. If you choose the wrong option, being a US resident, you will not be able to open an account with InstaTrade anyway.

We are sorry for any inconvenience caused by this message.