empty
20.01.2025 02:03 PM
Weekly Forecast Based on Simplified Wave Analysis for EUR/USD, USD/JPY, GBP/JPY, USD/CAD, NZD/USD, and Gold on January 20th

EUR/USD

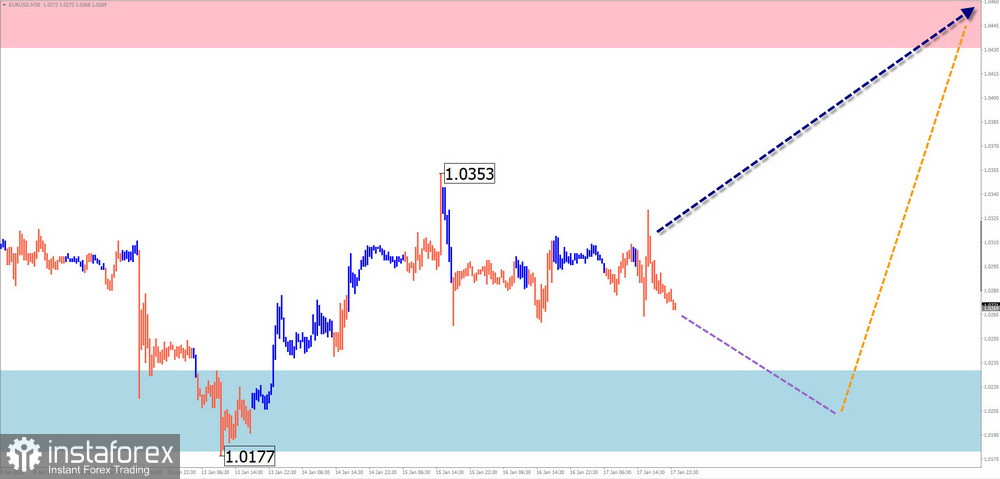
Analysis:Since August last year, the euro major pair has been developing a descending contracting flat pattern. The price decline brought quotes to the upper boundary of a strong weekly-scale potential reversal zone. Over the past three weeks, the price has moved sideways between opposing zones.

Forecast:This week, the euro is expected to continue its sideways movement. In the next couple of days, pressure on the support zone is likely, with a possible brief break below its lower boundary. Subsequently, the price is expected to return to the range between nearby zones, gradually rising toward the resistance level.

This image is no longer relevant

Potential Reversal Zones:

  • Resistance: 1.0430–1.0480
  • Support: 1.0230–1.0180

Recommendations:

  • Sell: Small volume sales are possible within specific trading sessions.
  • Buy: Lower volume purchases may be considered after reversal signals appear in the utilized trading system (TS).

USD/JPY

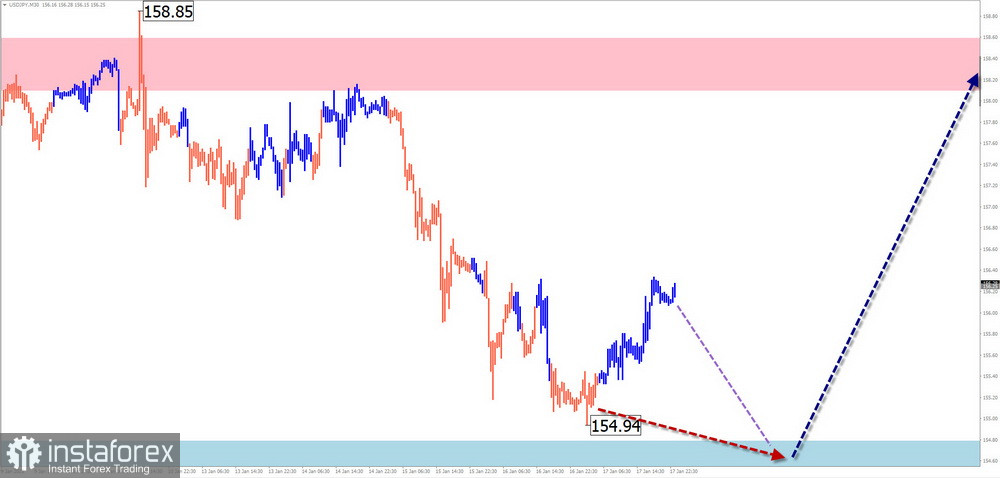
Analysis:Since last summer, the USD/JPY pair has been developing an upward zigzag wave. Since December, the price direction has reversed, forming a correctional phase. Currently, the wave structure remains incomplete. The bearish segment has reversal potential and could extend beyond a simple correction of the last trend wave.

Forecast:In the coming days, expect the price to move sideways, gradually declining toward the calculated support levels. By the week's end, a reversal and resumption of growth are expected, potentially bringing the price back to the resistance zone. A brief breach of the lower support boundary cannot be ruled out if the trend changes.

This image is no longer relevant

Potential Reversal Zones:

  • Resistance: 158.10–158.60
  • Support: 154.80–154.30

Recommendations:

  • Sell: No suitable conditions for sales.
  • Buy: Consider purchases after confirmed reversal signals within the support zone.

GBP/JPY

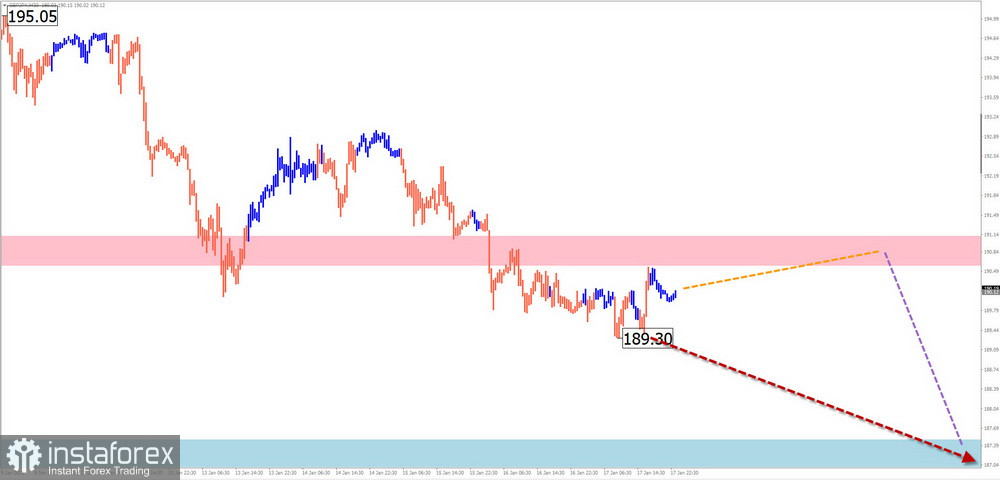
Analysis:Since December, a descending zigzag wave has been forming on the GBP/JPY pair chart. The wave structure remains incomplete, approaching a D1 timeframe level. Currently, the price has breached the boundaries of an intermediate support zone, which now acts as resistance. A correction is anticipated within the wave structure.

Forecast:This week, the upward segment is expected to complete. Near the calculated resistance zone, a reversal and resumption of the downtrend are likely. The highest activity is expected toward the end of the week.

This image is no longer relevant

Potential Reversal Zones:

  • Resistance: 190.60–191.10
  • Support: 187.50–187.00

Recommendations:

  • Buy: Not advisable.
  • Sell: Consider after reversal signals appear in the resistance zone.

USD/CAD

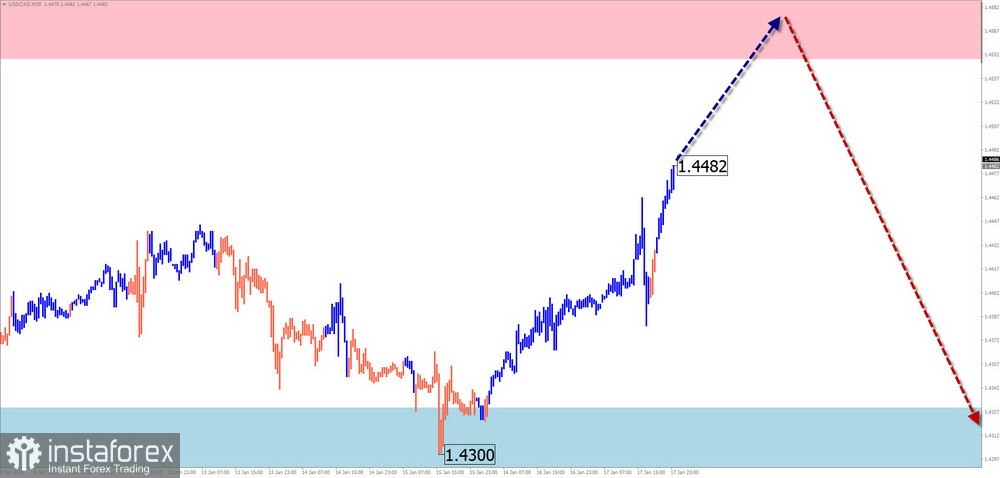
Analysis:Since late September, the USD/CAD pair has been forming an ascending wave. Over the past month, a counter-correction has emerged in the form of a stretched horizontal flat. This wave structure is incomplete as of now.

Forecast:Expect the uptrend to continue this week, potentially reaching the calculated resistance zone. A brief pullback toward the support boundary may occur early in the week, with increased volatility expected later in the week.

This image is no longer relevant

Potential Reversal Zones:

  • Resistance: 1.4550–1.4600
  • Support: 1.4330–1.4280

Recommendations:

  • Sell: Low potential, likely unprofitable.
  • Buy: Fractional volume purchases may be made following reversal signals in the support zone.

NZD/USD

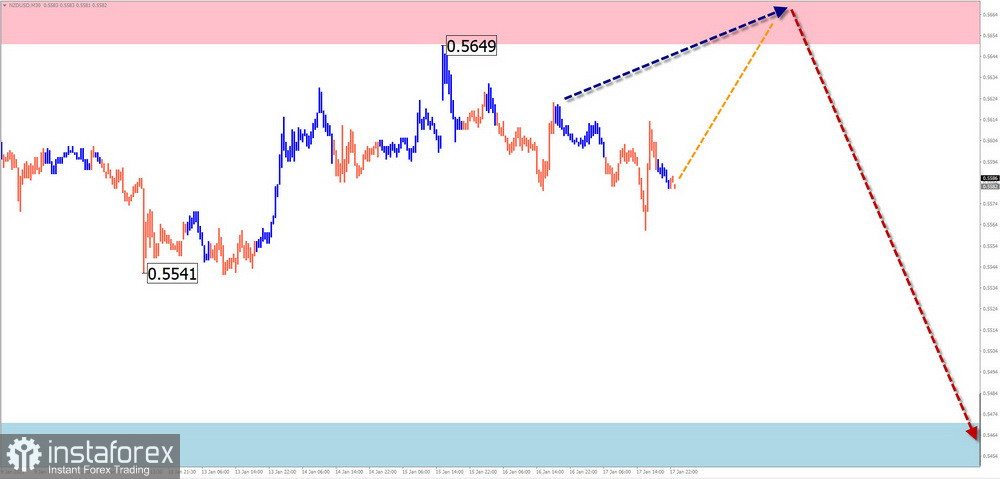
Analysis:Since late September, the NZD/USD pair has seen a steady decline. From mid-December, a counter-correction in the form of a stretched flat has been forming. Prices are moving along an intermediate support/resistance zone. The correction structure remains incomplete.

Forecast:A steady decline from the calculated resistance zone to the support zone is likely in the coming week. Early in the week, brief pressure and a breach of the upper resistance boundary cannot be ruled out.

This image is no longer relevant

Potential Reversal Zones:

  • Resistance: 0.5650–0.5700
  • Support: 0.5470–0.5420

Recommendations:

  • Buy: Not advisable.
  • Sell: Sales may become the primary strategy after confirmation signals appear.

GOLD

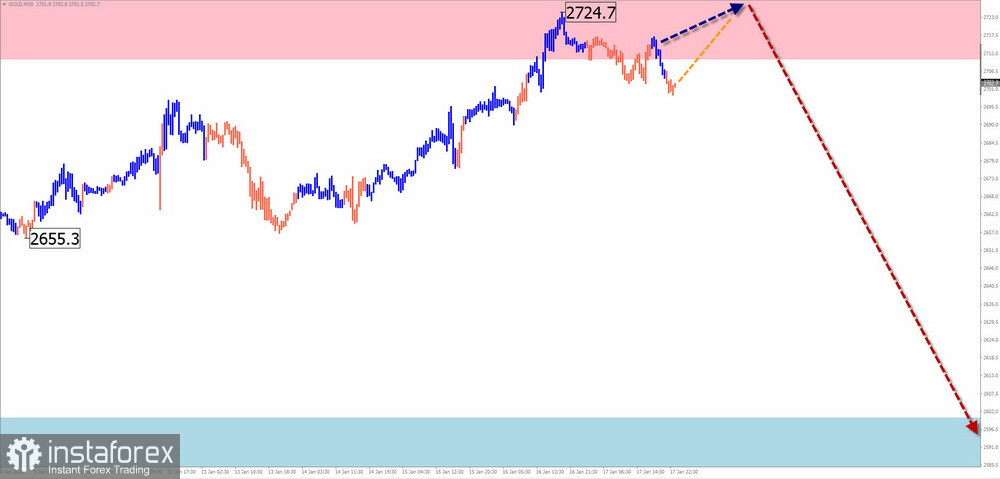
Analysis:Since late October, gold prices have been forming a descending horizontal flat within a larger uptrend. Prices are moving within a flat range near a weekly-scale potential reversal zone.

Forecast:Gold is expected to maintain its overall sideways movement this week. After likely pressure on the resistance zone, a reversal and gradual decline toward the support zone are anticipated.

This image is no longer relevant

Potential Reversal Zones:

  • Resistance: 2710.0–2730.0
  • Support: 2600.0–2580.0

Recommendations:

  • Sell: Fractional volume intraday sales may be considered.
  • Buy: No suitable conditions for purchases.

Notes on Simplified Wave Analysis (SWA):

  • All waves in SWA consist of three parts (A-B-C). The analysis focuses on the last, incomplete wave on each timeframe.
  • Dotted lines indicate expected price movements.
  • Caution: Wave algorithms do not account for the duration of movements over time!
Isabel Clark,
Analytical expert of InstaTrade
© 2007-2025

Recommended Stories

2025年8月11日英鎊兌美元分析

英鎊/美元的波浪形態繼續顯示上升動力波結構的形成。這種波浪圖幾乎與歐元/美元相同,因為唯一的「驅動因素」仍然是美元。

Chin Zhao 20:43 2025-08-11 UTC+2

2025年8月11日EUR/USD分析

在4小時圖中,EUR/USD的波浪形態已經保持數月不變,這是個積極信號。即便在修正波形成過程中,結構的完整性仍然保留,使得預測更加準確。

Chin Zhao 19:41 2025-08-11 UTC+2

2025年8月8日歐元/美元分析

歐元兌美元的四小時圖表中的波動模式已保持數月不變,這是一個非常積極的信號。即使在形成修正波時,結構的完整性也得以保持。

Chin Zhao 20:59 2025-08-08 UTC+2

2025年8月7日英鎊/美元分析

英鎊/美元的波浪形態繼續顯示出向上的衝擊波形態形成。該波浪圖幾乎與歐元/美元相同,因為唯一的“主要驅動因素”仍是美元。

Chin Zhao 20:18 2025-08-07 UTC+2

2025年8月7日,歐元/美元分析

在EUR/USD 4小時圖的波浪形態中,已經保持了數月不變,這是非常令人鼓舞的。即使在修正波形成時,整體結構依然保持完整。

Chin Zhao 20:14 2025-08-07 UTC+2

2025年8月6日 GBP/USD 分析

目前,英鎊兌美元(GBP/USD)的波浪形態顯示出多頭衝動結構的發展跡象。這種波浪配置幾乎與歐元兌美元(EUR/USD)相同,因為這裡唯一真正的驅動因素是美元。

Chin Zhao 21:55 2025-08-06 UTC+2

2025年8月6日歐元/美元分析

數月以來,EUR/USD工具的4小時圖的波浪模式一直保持不變,這是相當令人鼓舞的。即使在修正波形的形成過程中,其結構也保持穩定,允許進行準確的預測。

Chin Zhao 21:51 2025-08-06 UTC+2

2025年8月4日英鎊/美元分析

英鎊/美元貨幣對的波動模式繼續顯示出上升的衝擊波結構,與歐元/美元的波浪情況相似,因為近期運動的唯一「驅動力」仍然是美國美元。在更廣泛的市場上(中期),對美元的需求正在下降,因此許多貨幣工具顯示出幾乎相同的動態。

Chin Zhao 22:02 2025-08-04 UTC+2

2025年8月4日歐元/美元分析

在歐元/美元貨幣對的4小時圖中,波浪型態已經保持完好數月,這是非常令人鼓舞的。即使在修正階段中,結構的完整性依然得到保全,從而能做出準確的預測。

Chin Zhao 21:58 2025-08-04 UTC+2

基於簡化波浪分析的每週預測:GBP/USD、AUD/USD、USD/CHF、EUR/JPY、AUD/JPY、EUR/CHF 和美國美元指數 —— 8月4日

GBP/USD 分析:自年初以來,英鎊一直在上升。自七月中旬以來,該貨幣對一直在阻力區域附近橫盤波動,形成了一個中間修正。

Isabel Clark 10:07 2025-08-04 UTC+2
现在无法通话?
提出您的问题,用 在线帮助.
 

Dear visitor,

Your IP address shows that you are currently located in the USA. If you are a resident of the United States, you are prohibited from using the services of InstaFintech Group including online trading, online transfers, deposit/withdrawal of funds, etc.

If you think you are seeing this message by mistake and your location is not the US, kindly proceed to the website. Otherwise, you must leave the website in order to comply with government restrictions.

Why does your IP address show your location as the USA?

  • - you are using a VPN provided by a hosting company based in the United States;
  • - your IP does not have proper WHOIS records;
  • - an error occurred in the WHOIS geolocation database.

Please confirm whether you are a US resident or not by clicking the relevant button below. If you choose the wrong option, being a US resident, you will not be able to open an account with InstaTrade anyway.

We are sorry for any inconvenience caused by this message.