
আরও দেখুন


 23.10.2026 10:09 AM
A day of risk?aversion and a more aggressive rotation than before pummeled US equities. The Nasdaq 100 suffered its worst single?day drop since June, while the equal?weighted S&P 500 outperformed the cap?weighted index by the widest margin since 2024. Panic over perceived tech?company underperformance forced the Philadelphia Semiconductor Index down about 6.7%.
Dynamics of equal?weight vs. cap?weight S&P 500
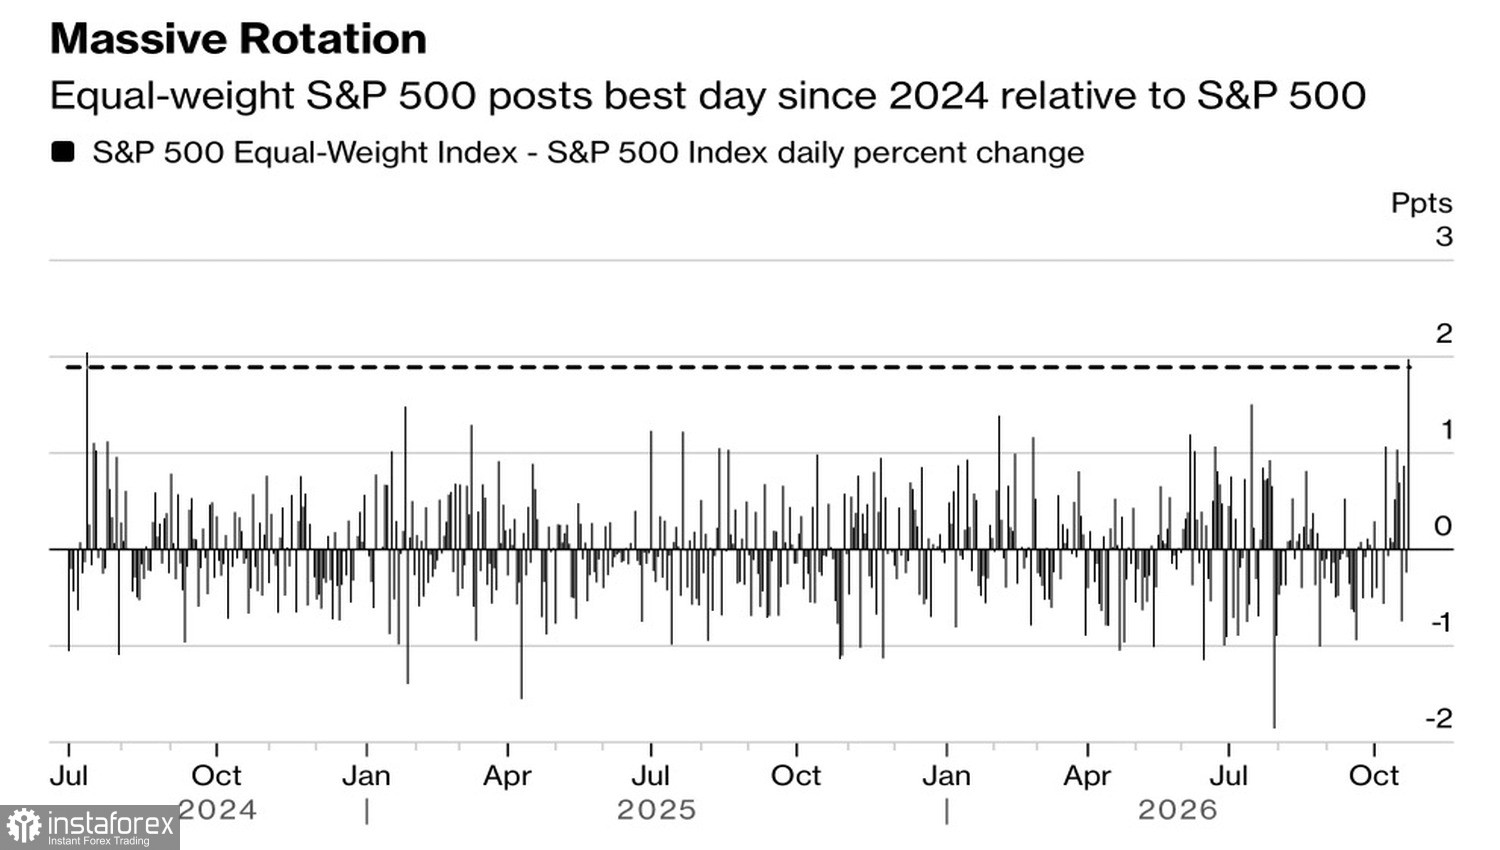
The market waved a red flag against an unfavorable external backdrop. Rising French yields above 5% amid a budget crisis and Brent rallying past $114/bbl on Middle East escalation boosted demand for safe havens and sent Treasury yields tumbling. Risk?off flows intensified as concerns over the fate of tech companies mounted.
Why the selling? Investors have long been nervous about AI. Sell?offs in AI?linked names are triggered by a range of fears: reports of intensifying competition (for example, news around DeepSeek), worries that enormous investments won't pay off, or rumors that capex is slowing — a potential signal that the AI bubble is nearing a rupture point. This time, the first two fears were the catalysts.
Meta Platforms warned that the combined surge in capital needs at Alphabet and SpaceX, together with Anthropic and OpenAI seeking funds via IPOs, creates a tougher fundraising environment. Meta said it plans to raise infrastructure funding for AI to $825 billion versus the $700 billion announced in July.
The market feared this race for capital would force companies to keep pouring money into AI without regard for returns. That kicked off a severe rotation as investors rotated out of previously favored tech giants into defensive sectors such as health care, consumer staples, and utilities.
Apple and Philadelphia Semiconductor Index Dynamics
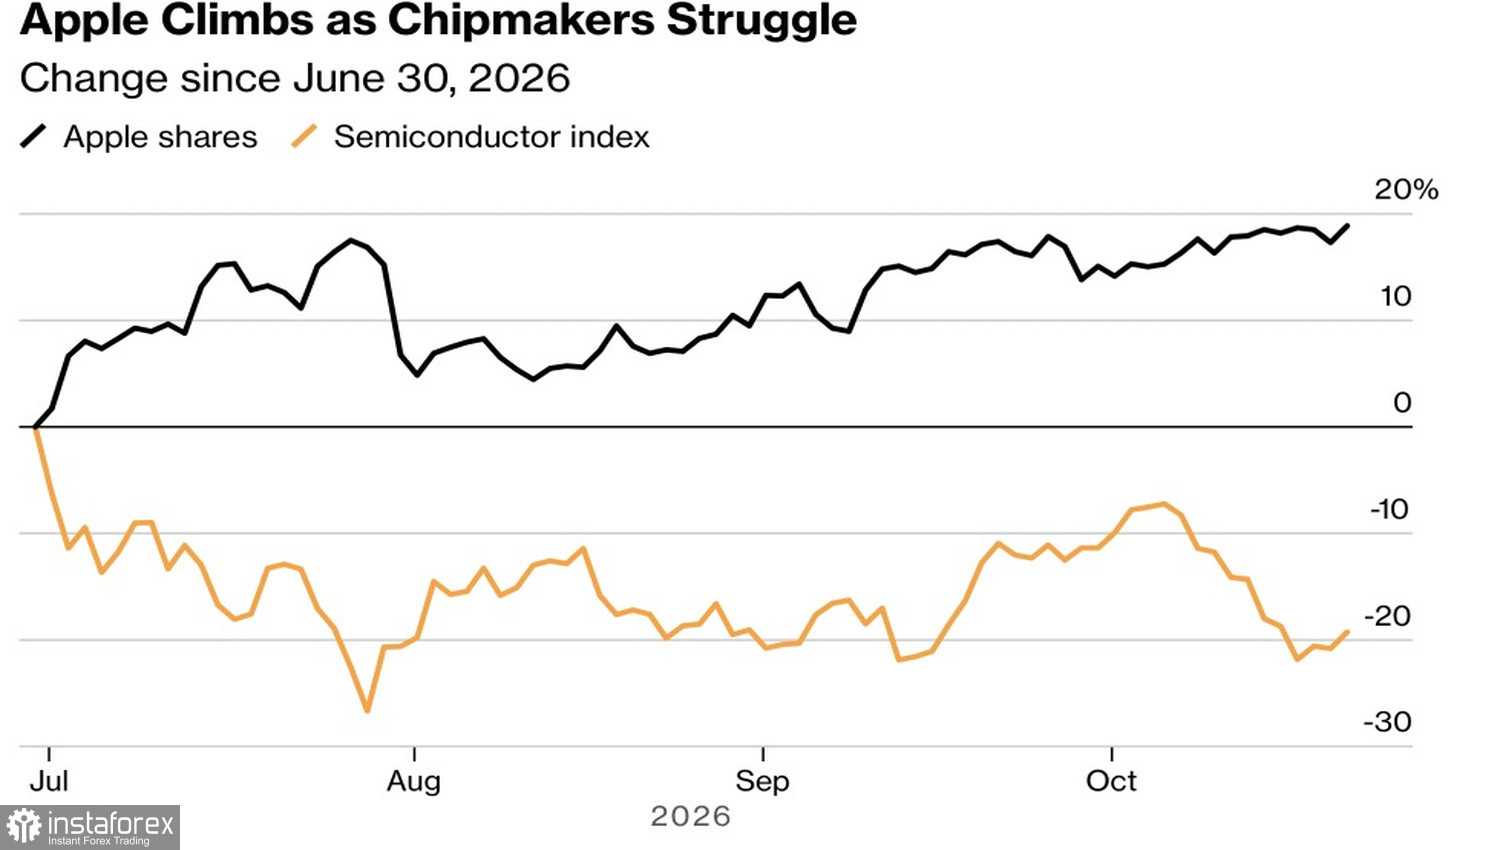
There was, however, an alternative within the S&P 500 this year. While many issuers joined the AI capex race, Apple did what it does best — sell hardware. Apple shares have rallied by 27% year?to?date and were the biggest contributor to the S&P 500's 12% advance.
Apple now looks stronger than most of the other Magnificent Seven, despite lagging in 2025. The market has even started to treat Apple as a sort of insurance against an AI bubble.
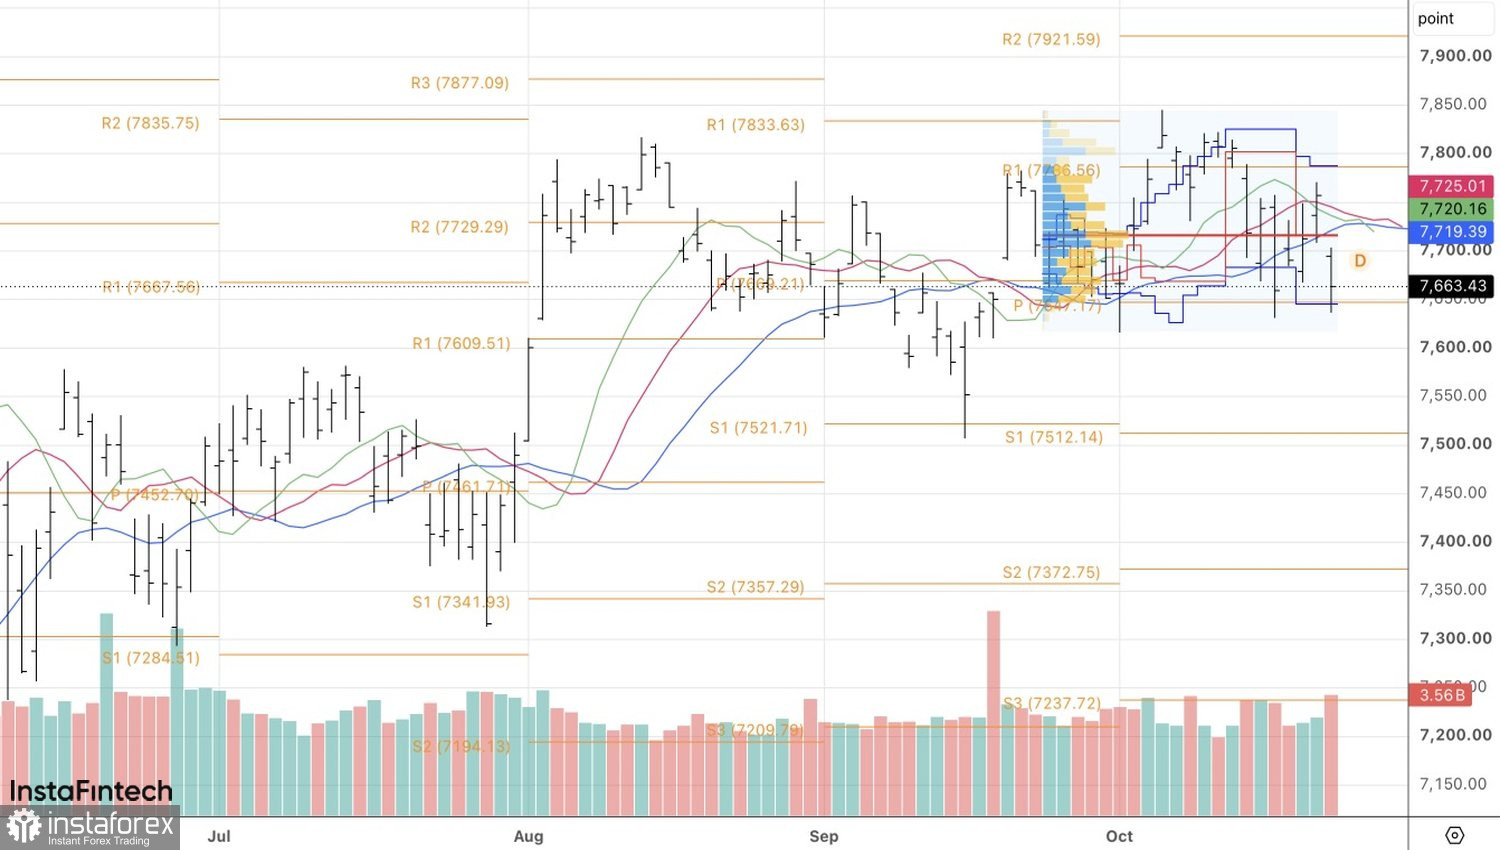
Technically, the daily S&P 500 chart shows that a break below fair value and a down?gap combination of moving averages indicate bearish strength. The 7,720 level is now key resistance. As long as the price trades below it, the bias favors selling.


