
 13.03.2023 10:01 AM
Trend analysis (Fig. 1).
The pound-dollar pair may move upward from the level of 1.2029 (closing of Friday's daily candle) to 1.2091, the 85.4% pullback level (yellow dotted line). From this level, the price may continue to move upward with the target at 1.2142, the upper fractal (yellow dotted line).
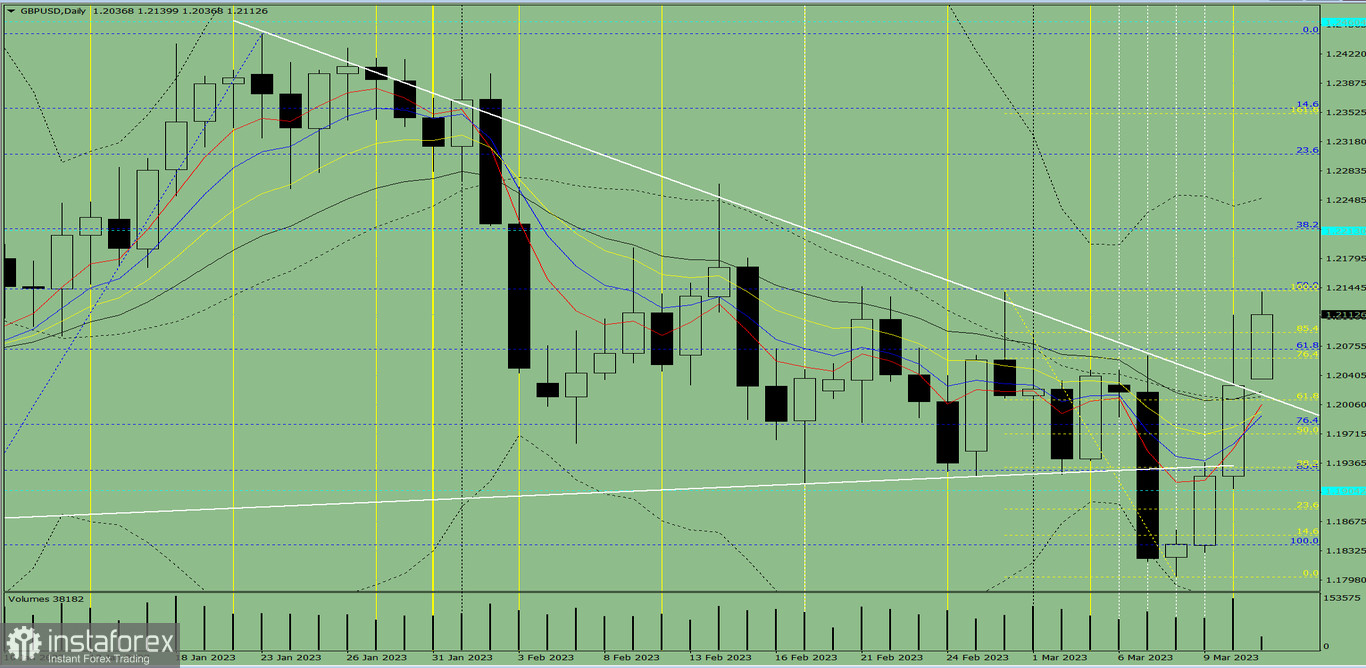
Fig. 1 (daily chart).
Comprehensive analysis:
General conclusion:
Today, the price may move upward from the level of 1.2029 (closing of Friday's daily candle) to 1.2091, the 85.4% pullback level (yellow dotted line). From this level, the price may continue to move upward with the target at 1.2142, the upper fractal (yellow dotted line).
Alternatively, the price may move upward from the level of 1.2029 (closing of the Friday daily candle) to 1.2091, the 85.4% pullback level (yellow dotted line). From this level, a downward movement is possible to 1.2061, the 76.4% pullback level (yellow dotted line).
You have already liked this post today
*The market analysis posted here is meant to increase your awareness, but not to give instructions to make a trade.

