
 13.03.2023 09:50 AM
Trend analysis (Fig. 1).
The euro-dollar pair may move upward from the level of 1.0641 (closing of Friday's daily candle) to 1.0746, the 61.8% pullback level (blue dotted line). When testing this level, the price may continue to move upward with the target at 1.0778, the 50.0% pullback level (red dotted line).
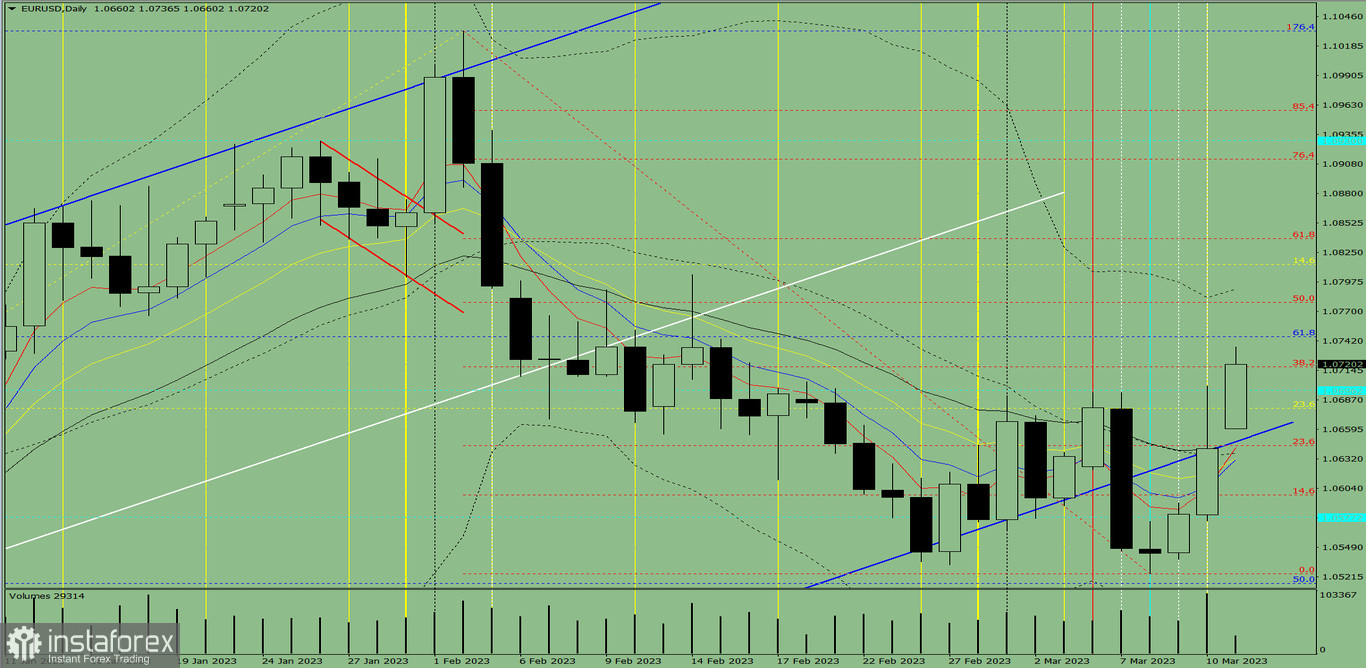
Fig. 1 (daily chart).
Comprehensive analysis:
General conclusion:
Today, the price may move upward from the level of 1.0641 (closing of Friday's daily candle) to 1.0746, the 61.8% pullback level (blue dotted line). When testing this level, the price may continue to move upward with the target at 1.0778, the 50.0% pullback level (red dotted line).
Alternatively, the price may move upward from the level of 1.0641 (closing of Friday's daily candle) to 1.0746, the 61.8% pullback level (blue dotted line). When testing this level, the price may move downward with the target at 1.0696, the historical support level (blue dotted line).
You have already liked this post today
*The market analysis posted here is meant to increase your awareness, but not to give instructions to make a trade.

