Bearish Rectangle
was formed on 13.06 at 19:39:32 (UTC+0)
signal strength 3 of 5
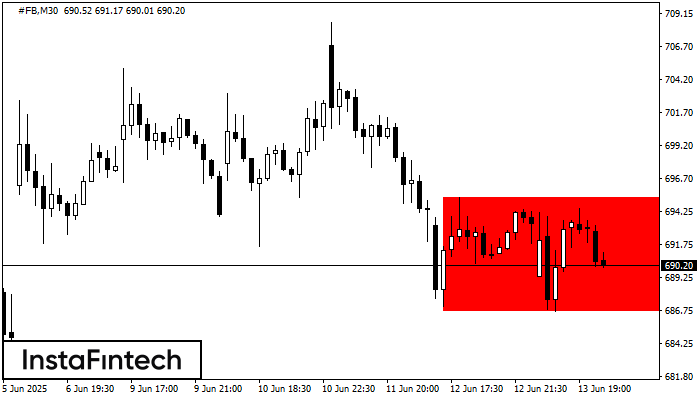
According to the chart of M30, #FB formed the Bearish Rectangle. This type of a pattern indicates a trend continuation. It consists of two levels: resistance 695.27 - 0.00 and support 686.69 – 686.69. In case the resistance level 686.69 - 686.69 is broken, the instrument is likely to follow the bearish trend.
- All
- All
- Bearish Rectangle
- Bearish Symmetrical Triangle
- Bullish Rectangle
- Double Top
- Double Top
- Triple Bottom
- Triple Bottom
- Triple Top
- Triple Top
- All
- All
- Buy
- Sale
- All
- 1
- 2
- 3
- 4
- 5
รูปแบบกราฟสี่เหลี่ยมผืนผ้าขาลง (Bearish Rectangle)
was formed on 20.06 at 17:03:59 (UTC+0)
signal strength 4 of 5
อ้างอิงจากชาร์ตของ H1, AUDCHF ที่ได้สร้างรูปแบบ รูปแบบกราฟสี่เหลี่ยมผืนผ้าขาลง (Bearish Rectangle) ออกมา รูปแบบนี้แสดงถึง ความต่อเนื่องในแนวโน้ม ขอบเขตด้านบนคือ 0.5307 ส่วนขอบเขตด้านล่างคือ 0.5277 สัญญาณนี้แสดงถึง
Open chart in a new window
รูปแบบกราฟหัวและหัวไหล่แบบกลับหัว (Inverse Head and Shoulder)
was formed on 20.06 at 16:49:47 (UTC+0)
signal strength 1 of 5
อ้างอิงจากชาร์ตของ M5, #MA ที่ได้สร้างรูปแบบ รูปแบบกราฟหัวและหัวไหล่แบบกลับหัว (Inverse Head and Shoulder) ออกมา ระดับสูงสุดของตำแหน่งหัวอยู่ที่ 538.15 ในขณะที่เส้นระดับกลางของแนวคอ จะอยู่ที่ 527.67/533.96
ขอบเตระยะเวลาใน M5 และ M15 อาจจะมีตำแหน่งการเข้าใช้งานที่ผิดพลาดมากยิ่งขึ้น
Open chart in a new window
รูปแบบกราฟจุดสองยอด (Double Top)
was formed on 20.06 at 16:00:11 (UTC+0)
signal strength 3 of 5
ในชาร์ตของ AUDUSD M30 พบว่า กราฟรูปแบบย้อนกลับ รูปแบบกราฟจุดสองยอด (Double Top) ได้ถูกสร้างขึ้นมา คุณลักษณะ: ขอบเขตด้านบน 0.6496; ขอบเขตด้านล่าง 0.6482; ความกว้างของกราฟรูปแบบนี้คือ
Open chart in a new window