Double Bottom
was formed on 06.06 at 00:20:24 (UTC+0)
signal strength 1 of 5
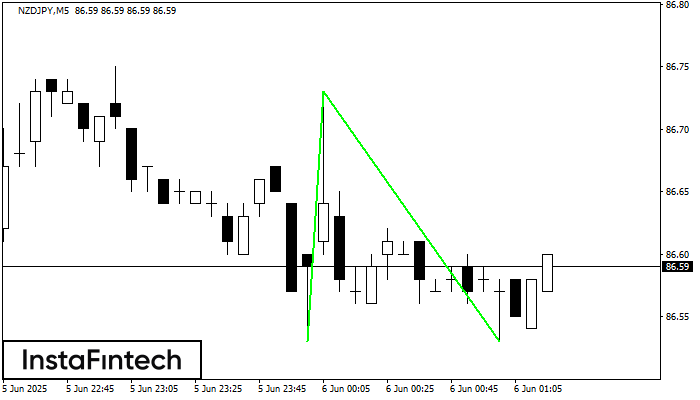
The Double Bottom pattern has been formed on NZDJPY M5; the upper boundary is 86.73; the lower boundary is 86.53. The width of the pattern is 20 points. In case of a break of the upper boundary 86.73, a change in the trend can be predicted where the width of the pattern will coincide with the distance to a possible take profit level.
The M5 and M15 time frames may have more false entry points.
- All
- All
- Bearish Rectangle
- Bearish Symmetrical Triangle
- Bullish Rectangle
- Double Top
- Double Top
- Triple Bottom
- Triple Bottom
- Triple Top
- Triple Top
- All
- All
- Buy
- Sale
- All
- 1
- 2
- 3
- 4
- 5
Bandera bajista
was formed on 19.06 at 09:57:29 (UTC+0)
signal strength 3 of 5
El patrón Bandera bajista ha sido formado en NZDUSD a M30. El límite inferior del patrón está ubicado en 0.5956/0.5970 mientras el límite superior se encuentra en 0.5978/0.5992. La proyección
Open chart in a new window
Bandera alcista
was formed on 29.05 at 22:16:27 (UTC+0)
signal strength 3 of 5
El patrón Bandera alcista que señala la continuación de una tendencia ha sido formado en el gráfico EURNZD M30. Pronóstico: si el precio rompe por encima del alza del patrón
Open chart in a new window
Bandera bajista
was formed on 27.05 at 19:34:24 (UTC+0)
signal strength 3 of 5
El patrón Bandera bajista ha sido formado en el gráfico AUDUSD M30. Por consiguiente, es probable que la tendencia bajista continúe a corto plazo. Tan pronto el precio rompa
Open chart in a new window