อ่านรายละเอียดเพิ่มเติม
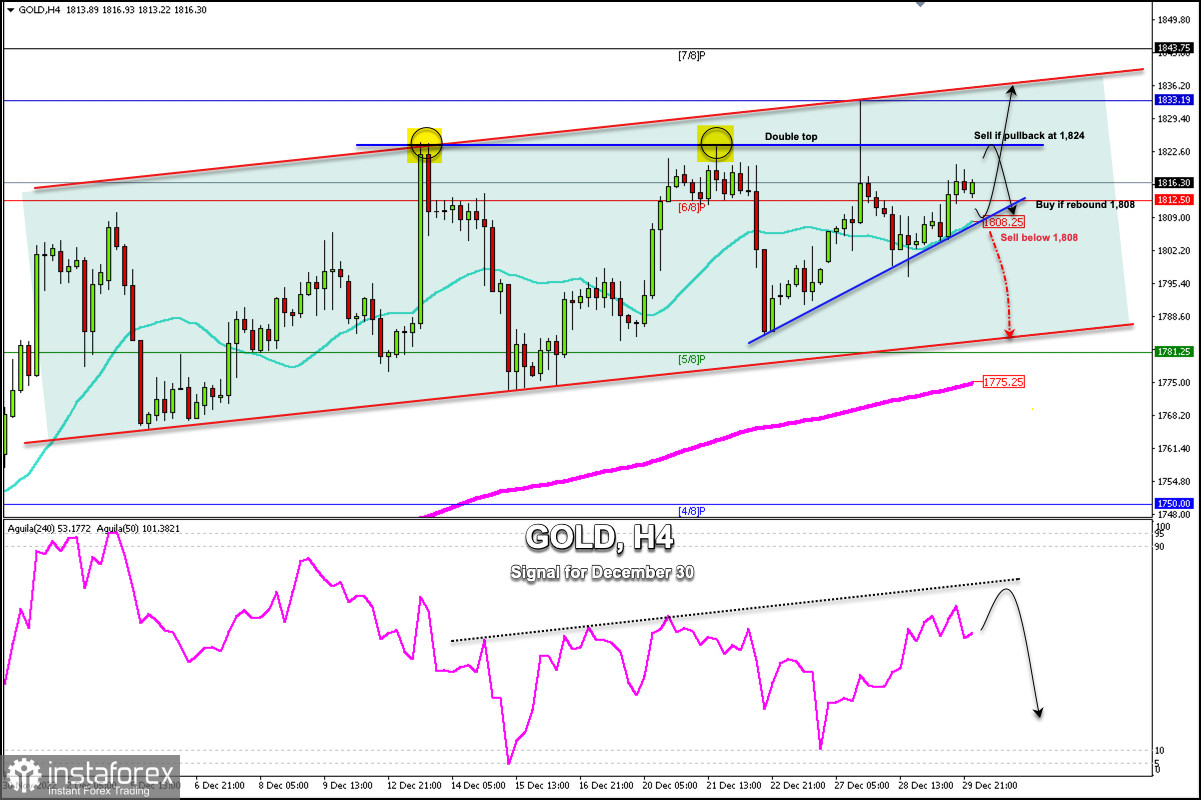
Early in the European session, Gold (XAU/USD) was trading around 1,816.30, above the 21 SMA and below the strong resistance at 1,823.
Yesterday, gold managed to accelerate its bullish movement after bouncing around 1,804. The strength of gold was caused by a fall in US bond yields, which weakened the US dollar and helped gold to approach the levels of 1,812 - 1,818.
On the technical level, according to the 4-hour charts, we can see the XAU/USD pair maintains the upward trend, it is expected to reach $1,824 again and climb up to the December maximum of 1,833.
In the graph, we can see that gold has formed a double top (technical reversal pattern). If in the next few hours, it reaches this area of 1,823, a triple top could be confirmed and we could expect a technical correction towards the 21 SMA in 1,808.
On the other hand, if in the next few hours, gold falls below 1,812, it is likely that there will be a slowdown in the bullish force and the price could reach the area of 1,808. A daily close below this level could mean a bearish movement and the price could reach 1,785 and drop even towards 5/8 Murray at 1,781.
The XAU/USD pair is likely to consolidate below 1,824 and above 1,808 in the next few hours. This range zone could define our next moves to buy or sell. Only daily close below the 21 SMA could mean a bearish acceleration and will be the key to sell in the next few days with targets at 1,775 (200 EMA).
You have already liked this post today
*บทวิเคราะห์ในตลาดที่มีการโพสต์ตรงนี้ เพียงเพื่อทำให้คุณทราบถึงข้อมูล ไม่ได้เป็นการเจาะจงถึงขั้นตอนให้คุณทำการซื้อขายตาม
คู่เงิน USD/JPY ยังคงอยู่ในช่วงการปรับตัวใกล้ระดับสูงในรอบสามสัปดาห์ ซึ่งได้รับการสนับสนุนจากความแข็งแกร่งของดอลลาร์สหรัฐและสัญญาณในตลาดที่ผสมกัน ดอลลาร์ได้รับแรงหนุนจากคำขู่ของประธานาธิบดี Donald Trump ของสหรัฐอเมริกาในการกำหนดภาษีนำเข้าสูงถึง 30% จากเม็กซิโกและสหภาพยุโรปตั้งแต่วันที่ 1 สิงหาคม ซึ่งส่งผลให้ความต้องการเงินที่เป็นที่ปลอดภัย เช่น เงินเยนญี่ปุ่น
การวิเคราะห์แนวโน้ม ในสัปดาห์นี้จากระดับ 1.3487 (ราคาปิดของกราฟแท่งเทียนรายสัปดาห์ครั้งที่ผ่านมา) ราคามีแนวโน้มที่จะลดลงต่อเนื่องไปยังเป้าหมายที่ 1.3374 — ซึ่งเป็นระดับการถอยกลับ 23.6% (เส้นประสีแดง) เมื่อทดสอบระดับนี้แล้ว ราคาอาจเริ่มเคลื่อนตัวขึ้นไปยังเป้าหมายที่ 1.3420 — ค่าเฉลี่ยเคลื่อนที่เชิงเส้นแบบทวีผู้หนัก
การวิเคราะห์แนวโน้ม (รูปที่ 1) สัปดาห์นี้ จากระดับ 1.1689 (ราคาปิดของแท่งเทียนรายสัปดาห์ก่อนหน้า) ตลาดอาจเคลื่อนตัวลงต่อ โดยมีเป้าหมายที่ระดับ 1.1536 ซึ่งเป็นระดับการย่อตัว 38.2% (เส้นประสีน้ำเงิน) เมื่อทดสอบระดับนี้แล้ว ราคาอาจเริ่มปรับตัวขึ้นสู่เป้าหมายที่
ในวันศุกร์คู่เงิน EUR/USD ฟื้นตัวจากระดับการปรับฐาน Fibonacci ที่ 127.2% ที่ 1.1712 แล้วหันกลับมาในทิศทางที่ได้เปรียบต่อดอลลาร์สหรัฐ และกลับมาลดลงต่อไปยังระดับ 1.1645 การฟื้นตัวจากระดับนี้จะสนับสนุนการกลับมาในทิศทางที่ได้เปรียบต่อยูโรและเพิ่มขึ้นปานกลางไปจนถึงระดับ 1.1712 การปิดระดับที่ต่ำกว่า 1.1645
ในกราฟรายชั่วโมง คู่เงิน GBP/USD เมื่อวันศุกร์มีการแกว่งตัวต่ำกว่าระดับ Fibonacci 127.2% ที่ระดับ 1.3527 และต่อมาได้ลดลงอย่างต่อเนื่องไปยังระดับการแก้ไขลำดับถัดไปที่ 100.0% ที่ระดับ 1.3444 การฟื้นตัวจากระดับนี้จะส่งผลดีต่อปอนด์อังกฤษ โดยบ่งชี้ว่าอาจมีการปรับตัวขึ้นอย่างเหมาะสมไปยังระดับ 1.3527
GBP/USD – วันจันทร์ที่ 14 กรกฎาคม 2025 ค่าเงิน GBP/USD กำลังอยู่ในสภาวะที่อ่อนแอ ซึ่งยืนยันได้จากการเคลื่อนไหวของราคาที่อยู่ต่ำกว่าเส้นค่าเฉลี่ยเคลื่อนที่ 50 วัน (50-EMA) และยังอยู่ต่ำกว่าเส้นค่าเฉลี่ยเคลื่อนที่
USD/CAD, 14 กรกฎาคม 2025 แม้ว่า Lonnie จะปรับตัวในทิศทางที่เป็นกลาง-ลาดขึ้น แต่ก็ยังมีโอกาสที่คู่สกุลเงิน USD/CAD จะทดสอบระดับ Pivot และแนวรับในวันนี้ ระดับสำคัญ 1. แนวต้าน
แท่งเทียนของวันศุกร์สำหรับคู่สกุลเงิน EUR/USD ปิดในลักษณะขาลง โดยราคาปรับฐานต่ำกว่าระดับเส้น MACD รายวัน เป้าหมายสำหรับวันนี้คือการปิดที่ต่ำกว่าระดับ 1.1692 เพื่อให้บรรลุเป้าหมายนี้ แท่งเทียนรายวันต้องปิดต่ำกว่าระดับดังกล่าว ทั้งนี้ ตัวบ่งชี้ Marlin ยังไม่เข้าสู่โซนลบ แต่คาดว่าจะทำได้ในวันพรุ่งนี้
เมื่อวันศุกร์ที่ผ่านมา เงินปอนด์ของอังกฤษอ่อนค่าลงกว่า 80 pips โดยลดลงต่ำกว่าระดับสมดุลรายวันและระดับสัญญาณสำคัญที่ 1.3510 การลดลงนี้ถูกกระตุ้นจากข้อมูล GDP และการผลิตอุตสาหกรรมที่อ่อนแอ การประมาณการ GDP ในเดือนพฤษภาคมแสดงให้เห็นว่า -0.1% เทียบกับที่คาดการณ์ไว้ที่ +0.1%
บนกราฟรายวัน คู่เงิน AUD/USD อยู่ระหว่างเส้น MACD (0.6551) และขอบบนของช่องราคาท้องถิ่น (สีน้ำเงิน, 0.6597) การฝ่าเส้นระดับใดระดับหนึ่งจะแสดงถึงความตั้งใจของราคาที่จะไปต่อในทิศทางที่เลือก อย่างไรก็ตาม สำหรับเป้าหมายด้านบวก ระดับ 0.6650 นั้นใกล้เคียงมาก
สมาชิกInstaForex
Your IP address shows that you are currently located in the USA. If you are a resident of the United States, you are prohibited from using the services of InstaFintech Group including online trading, online transfers, deposit/withdrawal of funds, etc.
If you think you are seeing this message by mistake and your location is not the US, kindly proceed to the website. Otherwise, you must leave the website in order to comply with government restrictions.
Why does your IP address show your location as the USA?
Please confirm whether you are a US resident or not by clicking the relevant button below. If you choose the wrong option, being a US resident, you will not be able to open an account with InstaTrade anyway.
We are sorry for any inconvenience caused by this message.