อ่านรายละเอียดเพิ่มเติม
H4 time frame
Outlook for gold and silver on 4 November 2020
Previous outlook for gold and silver on the four-hour time frame on October 27,2020
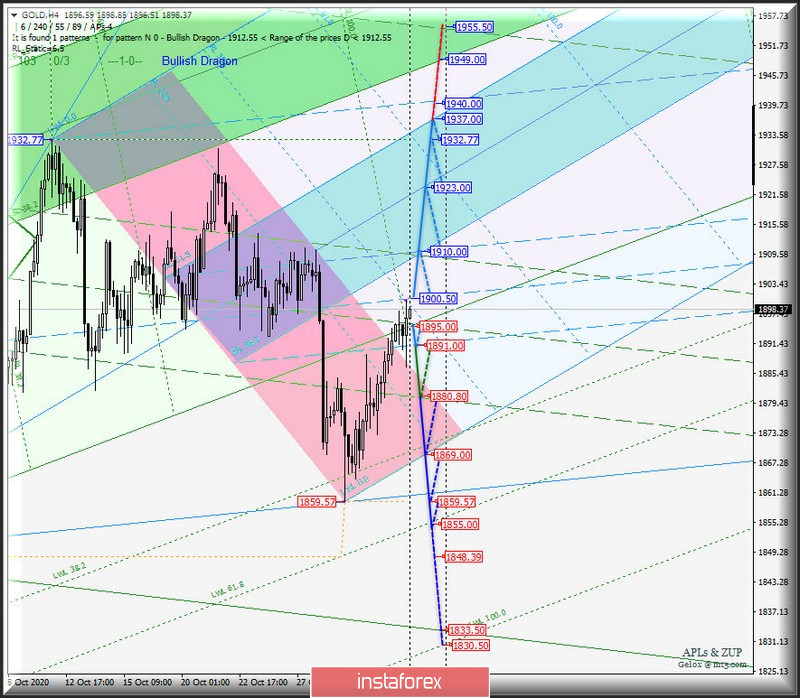
Spot Gold
On November 4, 2020, the development of Spot Gold will be determined by a break of the range:
A break of 1/2 Median Line located at the resistance level of 1900.00 will push the gold price to the zone of (1910.00 - 1923.00 - 1937.00) considering testing the local high of 1932.77. The price may also reach Shiff Line (1940.00).
A break of the 1/2 Median Line located at the support level of 1895.00 is another variant of the downward movement development. The main targets are the following:
- lower border of the channel 1/2 Median Line (1891.00);
- lower limit of the channel 1/2 Median Line (1880.80);
- initial SSL line (1869.00);
The price may again hit the local low of 1859.57 and reach the warning line LWL 61.8 Minute (1855.00).
Details of Spot Gold movement on November 4, 2020 can be seen in the animated *. gif chart (opens in a separate tab).
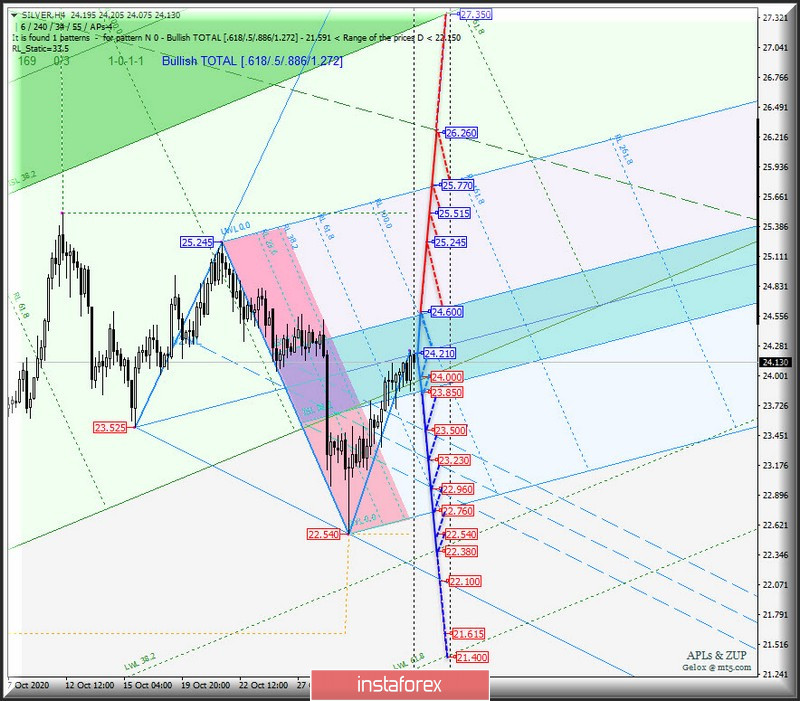
Spot Silver
Spot Silver from November 4, 2020 will move depending on the direction of a break of the limits of the equilibrium zone (23.850 - 24.210 - 24.600)
Movement inside this zone is shown in an animated *. gif graph (opens in a separate tab). If there is a break of the upper limit of ISL 61. 8 of the equilibrium zone located near the resistance level of 24.600, the upward movement of Spot Silver can be continued to the following targets:
- Highs of 25.245 - 25.515;
- the final line FSL (25.770);
- the final Shiff Line (26.260).
If the price breaks the lower limit of the ISL38.2 of the equilibrium zone located near the support level of 23.850, Spot Silver may continue dropping to the limits of the channel 1/2 Median Line (23.500 - 23.230 - 22.960) and even reach the initial SSL line (22.760) and then update the local low of 22.540.
The review is prepared without taking into account the news background, the opening of trading sessions of the main financial centers and is not a guide to action (placing "sell" or "buy" orders).
More Analytics on the InstaTrade website.
You have already liked this post today
*บทวิเคราะห์ในตลาดที่มีการโพสต์ตรงนี้ เพียงเพื่อทำให้คุณทราบถึงข้อมูล ไม่ได้เป็นการเจาะจงถึงขั้นตอนให้คุณทำการซื้อขายตาม
ในวันศุกร์ คู่เงิน EUR/USD เกิดการรีบาวด์จากโซนแนวรับที่ 1.1637–1.1645 หันกลับมาให้ประโยชน์กับเงินยูโร และรวมตัวเหนือระดับการรีเทรซ 76.4% ที่ 1.1695 ดังนั้น การเติบโตอาจดำเนินต่อในวันนี้มุ่งไปสู่ระดับการรีเทรซถัดไป 100.0% ที่ 1.1789
ในกราฟรายชั่วโมง คู่สกุลเงิน GBP/USD ในวันศุกร์ได้เคลื่อนตัวกลับมาในทิศทางปรับฐานสู่ระดับการดึงกลับ 100.0% ที่ 1.3586 อย่างไรก็ตาม สัญญาณการซื้อขายล่าสุดถูกสร้างขึ้นในวันพฤหัส — การดีดตัวออกจากระดับ 1.3586 ซึ่งสัญญาณนี้ยังคงมีผลอยู่ ดังนั้น ในวันจันทร์
ในขณะนี้ คู่เงินอยู่ที่ระดับกลม 1.1700 ใกล้กับจุดสูงสุดของสัปดาห์ที่แล้ว รูปแบบ engulfing ในวันศุกร์บ่งชี้ว่าคู่เงินนี้พร้อมที่จะเติบโตพร้อมกับการแก้ไขเล็กน้อย ตัวชี้วัดการแกว่งบนแผนภูมิรายวันแสดงสัญญาณบวก ซึ่งสนับสนุนแนวโน้มขาขึ้น การสนับสนุนใกล้ที่สุดอยู่ที่เส้น EMA 9 วัน บริเวณ 1.1666
การวิเคราะห์แนวโน้ม ในสัปดาห์นี้ จากระดับ 1.3553 (ราคาปิดของแท่งเทียนรายสัปดาห์ก่อนหน้า) ราคาอาจเริ่มเคลื่อนตัวลงไปยังระดับ 1.3389 ซึ่งเป็นระดับการปรับฐาน 23.6% (เส้นประสีแดง) เมื่อทดสอบระดับนี้แล้ว ราคาอาจเด้งกลับขึ้นไปที่ 1.3444 ซึ่งเป็นเส้น
การวิเคราะห์แนวโน้ม (รูปที่ 1) ในสัปดาห์นี้ จากระดับ 1.1704 (การปิดของแท่งเทียนรายสัปดาห์ก่อนหน้า) ตลาดอาจเริ่มเคลื่อนตัวลงไปยังเป้าหมายที่ 1.1536 ซึ่งเป็นระดับการย้อนกลับ 38.2% (เส้นประสีฟ้า) เมื่อลองทดสอบระดับนี้แล้ว ราคาก็อาจจะเคลื่อนตัวขึ้นไปยัง 1.1571
การวิเคราะห์แนวโน้ม (รูปที่ 1) ในวันจันทร์ ตลาดจากระดับ 1.3553 (ราคาปิดรายวันของวันศุกร์) อาจเริ่มมีการเคลื่อนตัวลงเป้าหมายที่ระดับ 1.3486 ซึ่งเป็นระดับการย้อนกลับ 23.6% (เส้นประสีเหลือง) หลังจากทดสอบระดับนี้แล้ว ราคาสามารถกลับขึ้นไปสู่ระดับ 1.3498
การวิเคราะห์แนวโน้ม (รูปที่ 1) ในวันจันทร์ ตลาดอาจเริ่มเคลื่อนไหวลงจากระดับ 1.1704 (ปิดวันศุกร์) โดยมีเป้าหมายที่ 1.1653 ซึ่งเป็นระดับการพักตัว 14.6% (เส้นปะสีน้ำเงิน) เมื่อถึงระดับนี้ อาจมีการเคลื่อนไหวลดลงต่อไปถึง 1.1626
ลิงก์ที่มีประโยชน์: บทความอื่น ๆ ของฉันสามารถอ่านได้ในส่วนนี้ คอร์สสำหรับผู้เริ่มต้นของ InstaForex การวิเคราะห์ยอดนิยม เปิดบัญชีการซื้อขาย ข้อสำคัญ: ผู้เริ่มต้นในตลาดซื้อขายฟอเร็กซ์จำเป็นต้องระมัดระวังเป็นพิเศษเมื่อทำการตัดสินใจเข้าสู่ตลาด โดยเฉพาะก่อนการประกาศรายงานสำคัญ มันจะดีกว่าถ้าหลีกเลี่ยงการเข้าสู่ตลาด เพื่อป้องกันไม่ให้เกิดการผันผวนของตลาดที่รุนแรงเนื่องจากความแปรปรวนที่เพิ่มขึ้น และหากคุณตัดสินใจที่จะซื้อขายในช่วงที่มีการประกาศข่าว ควรวางคำสั่ง
การเจรจาระหว่างวลาดิมีร์ ปูติน และโดนัลด์ ทรัมป์ ในเมืองแองเคอเรจจบลงด้วยโทนที่เป็นกลาง อาจมีการทำข้อตกลงบางอย่าง แต่ความก้าวหน้าใด ๆ น่าจะเกิดขึ้นในอนาคต ตลาดพลังงานซึ่งไวต่อการเมืองที่สุดกำลังดำเนินการด้วยความรอบคอบในแง่ของความหวังที่เป็นบวก ค่าเงินยูโรเปิดสัปดาห์ใหม่ด้วยการปรับตัวลดลง—วันนี้นับเป็นวันแรกหลังจากเส้นเวลา Fibonacci ที่ 8 ตามสถานการณ์หลัก
ค่าเงินปอนด์อังกฤษปิดตลาดเมื่อวันศุกร์ด้วยการเพิ่มขึ้น และวันจันทร์เปิดตลาดด้วยความมองในแง่ดีต่อเนื่อง ดังที่ได้กล่าวไว้ก่อนหน้านี้ ค่าเงินปอนด์เคลื่อนไหวอยู่ภายในหลายช่วงพร้อมกัน ตอนนี้เราเห็นการดีดตัวขึ้นจากระดับแนวรับที่ 1.3525 ซึ่งบ่งชี้ว่าช่วงระหว่าง 1.3525–1.3631 กำลังถูกทดสอบ โดยราคากำลังเคลื่อนตัวไปยังขอบบนของช่วงนี้ ในกรณีนี้ คาดหมายได้ว่าจะมีการย้อนกลับไปยังแนวรับที่ 1.3525 ตามด้วยการเพิ่มขึ้นของคลื่นใหม่ไปสู่จุดสูงสุดของวันที่
ตัวเลขในInstaForex
Your IP address shows that you are currently located in the USA. If you are a resident of the United States, you are prohibited from using the services of InstaFintech Group including online trading, online transfers, deposit/withdrawal of funds, etc.
If you think you are seeing this message by mistake and your location is not the US, kindly proceed to the website. Otherwise, you must leave the website in order to comply with government restrictions.
Why does your IP address show your location as the USA?
Please confirm whether you are a US resident or not by clicking the relevant button below. If you choose the wrong option, being a US resident, you will not be able to open an account with InstaTrade anyway.
We are sorry for any inconvenience caused by this message.