อ่านรายละเอียดเพิ่มเติม
Operational scale Minute (h4 timeframe )
Second half of October - the dollar index #USDX and the GBP in the h4 timeframe - What's next? - Review of traffic options from October 16, 2020
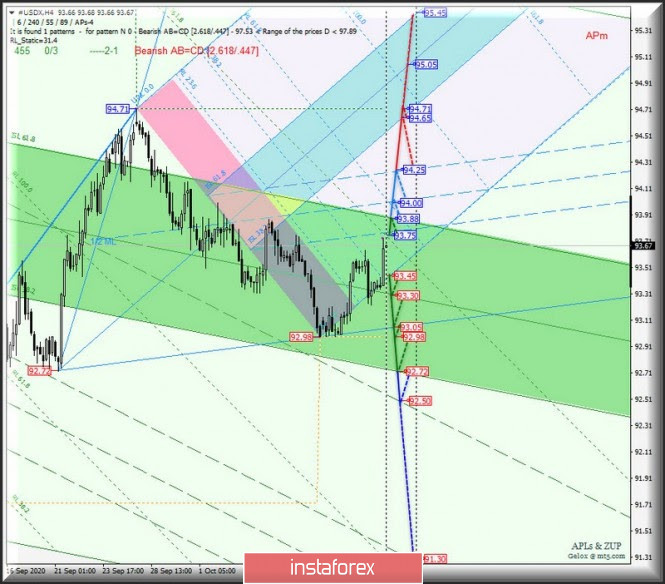
____________________
US Dollar Index
The development of the movement of the dollar index #USDX from October 16, 2020 will continue in the equilibrium zone (92.72 - 93.30 - 93.88) forks of the operational scale Minute, taking into account the development and direction of the breakdown of the range:
The breakdown of the resistance level of 93.75 - continued development of the movement #USDX within the boundaries of the channel 1/2 Median Line Minuette (93.75 - 94.00 - 94.25) with the prospect of reaching the lower border ISL38.2 (94.65) zone equilibrium fork operational scale Minuette and c, then updating the local maximum 94.71.
A joint breakdown of the support level of 93.75 on the initial SSL fork line of the Minuette operational scale and the Median Line Minute (93.30) will make it relevant to develop the movement of the dollar index towards the goals:
- LTL Minuette control line (93.05);
- local minimum 92.98;
- lower limit ISL61.8 (92.72) of the fork equilibrium zone of the operational scale Minute;
- the ultimate Shiff Line Minuette (92.50).
___________________
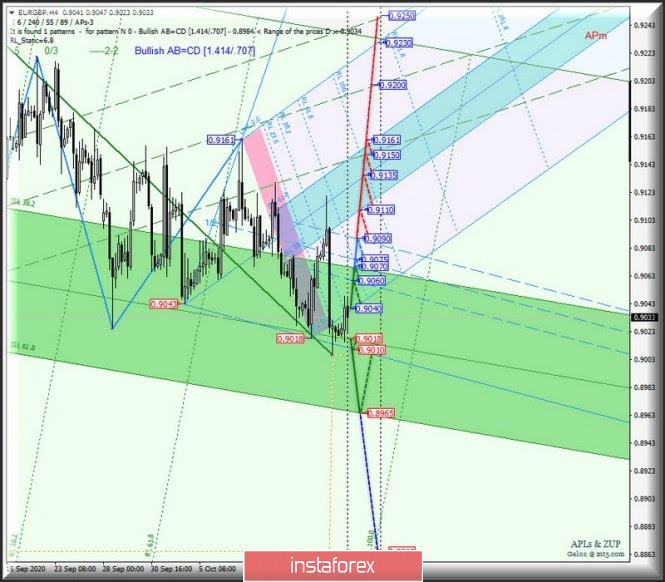
Euro vs Great Britain Pound
The movement of the "main" cross-instrument EUR/GBP from October 16, 2020 will also occur in the equilibrium zone (0.8965 - 0.9018 - 0.9070) forks of the operational scale Minute depending on the working out and direction of the range breakdown:
A breakdown of the Median Line Minute - support level 0.9018 - followed by a breakdown of the LTL control line (0.9010) of the Minuette operating scale forks - will determine the development of a downward movement of EUR/GBP to the lower border of ISL61.8 (0.8965) of the equilibrium zone of the Minute operating scale forks with the prospect of reaching the local minimum 0.8865.
If the resistance level of 0.9060 is broken, the movement of the "main" cross-instrument will continue in the channel 1/2 Median Line Minuette (0.9060 - 0.9075 - 0.9090) with the possibility of reaching the boundaries of the equilibrium zone (0.9110 - 0.9135 - 0.9161) a fork of the Minuette operational scale.
____________________
The review is compiled without taking into account the news background, the opening of trading sessions of the main financial centers and is not a guide to action (placing "sell" or "buy" orders).
You have already liked this post today
*บทวิเคราะห์ในตลาดที่มีการโพสต์ตรงนี้ เพียงเพื่อทำให้คุณทราบถึงข้อมูล ไม่ได้เป็นการเจาะจงถึงขั้นตอนให้คุณทำการซื้อขายตาม
เมื่อวันพฤหัสบดี คู่สกุลเงิน EUR/USD ยังคงปรับตัวลดลงไปยังระดับ 1.1645 ขณะที่ระดับการแก้ไข Fibonacci ที่ 127.2% ที่ 1.1712 ส่วนใหญ่ถูกละเลยโดยผู้ค้า การฟื้นตัวจากระดับ 1.1645 จะเอื้อประโยชน์ให้กับเงินยูโรและอาจนำไปสู่การเพิ่มขึ้นในระดับปานกลางไปยัง
ในกราฟรายชั่วโมง คู่สกุลเงิน GBP/USD เมื่อวันพฤหัสบดีได้ดีดตัวจากแนวต้านที่ระดับ 1.3611–1.3633 และกลับมาเคลื่อนไหวลดลงไปที่ระดับ 127.2% ของ Fibonacci ที่ 1.3527 การดีดตัวจากระดับนี้จะส่งผลดีต่อฝ่ายปอนด์และอาจทำให้ราคากลับขึ้นไปที่ระดับ 1.3611–1.3633 ได้ การปิดต่ำกว่าระดับ
XAU/USD, วันศุกร์ที่ 11 กรกฎาคม 2025 แม้ว่าดูเหมือนว่าจะปรับฐานเนื่องจากถูกถือไว้ที่แนวต้าน 1 แต่ด้วยสภาวะทางเทคนิคและปัจจัยพื้นฐานที่แข็งแกร่งต่อเนื่องของ XAU/USD เปิดโอกาสให้ XAU/USD ยังมีแนวโน้มแข็งค่าต่อไปได้ ระดับที่สำคัญ 1. แนวต้าน
บนกราฟรายสัปดาห์ของ EUR/USD เราพบชุดสัญญาณการกลับตัวที่ประกอบไปด้วย: การเกิด divergence, การเปลี่ยนแปลงแนวโน้มในโซนเวลาฟีโบนัชชี, และการดีดตัวของราคาเมื่อเกิดการตัดกันระหว่างสองเส้นที่แข็งแกร่ง — ขอบเขตของช่องราคากับรังสีฟีโบนัชชี. หากสัปดาห์ปิดแม้อยู่ที่ระดับปัจจุบัน แนวถนนระยะยาวขาลง (มุ่งสู่ 0.9260) จะเปิดสำหรับยูโร บนกราฟรายวัน
บนกราฟรายเดือน GBP/USD ปอนด์อังกฤษได้ปรับตัวกลับจากระดับตอบสนองฟีโบนักชีที่ 161.8% ซึ่งคำนวณจากขอบด้านบนของช่องราคาทั่วโลกในระยะเวลา 18 ปีทันทีหลังจากเส้นเวลา Fibonacci เส้นที่ 8 ค่าเงินปอนด์อาจเผชิญกับการลดลงในระยะยาว ซึ่งอาจจะเป็นไปได้ถึงขั้นที่น่ากังวลไปจนถึงระดับที่เสมอภาคได้ บนกราฟรายสัปดาห์ เราได้สังเกตการแยกตัวและระดับเป้าหมายที่อยู่ใกล้สองระดับ (เมื่อเทียบกับช่วงเวลานี้)
USD/CAD ดอลลาร์แคนาดาได้มีการเคลื่อนไหวแบบสะสมตัวเป็นเวลาสามวันก่อนที่จะมีการกระทำแบบฝ่าขึ้นในช่วงการซื้อขายแปซิฟิกวันนี้ ราคาได้ทะลุผ่านเส้นสมดุลด้วยเงาบนของมัน หลังจากหยุดชั่วคราวที่เส้นศูนย์ เส้นสัญญาณของออสซิลเลเตอร์ Marlin ได้เริ่มเพิ่มขึ้นอย่างมั่นใจแล้ว ดูเหมือนว่าราคากำลังมุ่งหน้าไปยังระดับเป้าหมายที่ 1.3860 ซึ่งเป็นระดับสูงสุดตั้งแต่วันที่ 29 พฤษภาคม หากนี่เป็นการกลับตัวของแนวโน้ม หรือแม้แต่การแก้ไขเชิงลึก จุดต้านทานที่ใกล้ที่สุดซึ่งอยู่ระหว่าง
เมื่อวันพุธ คู่เงิน EUR/USD ยังคงเคลื่อนตัวไปในแนวทางที่มีเพียงตนเองรู้ ระดับการปรับตัว 127.2% ของ Fibonacci ที่ 1.1712 ถูกเพิกเฉยจากนักเทรดอีกครั้ง ฉันยังคงไม่แนะนำให้ใช้เป็นตัวอ้างอิงสำหรับสัญญาณการซื้อขาย—ยกเว้นอาจจะเป็นสัญญาณซื้อ เนื่องจากพื้นหลังของข่าวปัจจุบันยังคงสนับสนุนการเติบโตของเงินยูโร ในช่วงไม่กี่สัปดาห์ที่ผ่านมา ฝ่ายขายยังไม่สามารถแสดงความแข็งแกร่งที่แท้จริงออกมาได้
บนกราฟหนึ่งชั่วโมงในวันพุธ คู่เงิน GBP/USD ยังคงเคลื่อนไหวในทิศทางขาขึ้นต่อเนื่องหลังจากดีดตัวจากระดับการปรับค่า Fibonacci ที่ 127.2% ที่ 1.3527 การดีดตัวนี้เกิดขึ้นอย่างแม่นยำ นำไปสู่การกลับตัวที่เป็นบวกต่อเงินปอนด์อังกฤษและกลับไปที่ระดับแนวต้านที่ 1.3611–1.3633 ฉันมั่นใจพอสมควรว่าระดับนี้จะถูกทะลุในอนาคตอันใกล้—อาจจะแม้แต่วันนี้ ภูมิหลังของข้อมูลในสัปดาห์นี้ทำให้ดอลลาร์สหรัฐรักษาแรงดึงตัวที่เพิ่มขึ้นล่าสุดได้ยาก การปิดเหนือระดับ
เมื่อวันพฤหัสบดี คู่สกุลเงิน GBP/JPY ได้รับแรงหนุนให้กลับมาสู่แนวโน้มขาขึ้นอีกครั้งและแสดงสัญญาณความพร้อมสำหรับการขยายตัวต่อไป การก่อตัวของช่องทางขาขึ้นยืนยันถึงความมั่นคงของแนวโน้มขาขึ้นนี้ ในช่วงการซื้อขายเอเชีย ผู้ซื้อมีความกระตือรือร้นมากขึ้นใกล้ระดับ 198.40–198.35 ซึ่งช่วยจำกัดการปรับตัวลดลงจากระดับสูงสุดของปีที่เคยถึงในช่วงก่อนหน้า คู่สกุลเงินนี้ปัจจุบันเคลื่อนที่อยู่รอบระดับจิตวิทยาที่ 199.00 และยังคงมีแนวโน้มขาขึ้น ในช่วงสองเดือนที่ผ่านมา คู่สกุลเงินนี้เคลื่อนที่ภายในช่องทางขาขึ้นซึ่งบ่งบอกถึงการเติบโตอย่างต่อเนื่อง ตัววัดสัญญาณออสซิลเลเตอร์ในกราฟรายวันยังคงอยู่ในดินแดนบวกและยังไม่เข้าสู่สภาวะที่ซื้อมากเกินไป
USD/CHF, วันพฤหัสบดีที่ 10 กรกฎาคม 2025 นอกจากข่าวลือเกี่ยวกับการตัดสินใจลดอัตราดอกเบี้ยของ Fed และการลดลงของอัตราดอกเบี้ยพันธบัตรรัฐบาลสหรัฐ USD/CHF ลดลงในวันนี้ ระดับที่สำคัญ 1. แนวต้าน 2: 0.7990
InstaForex
บัญชี PAMM
Your IP address shows that you are currently located in the USA. If you are a resident of the United States, you are prohibited from using the services of InstaFintech Group including online trading, online transfers, deposit/withdrawal of funds, etc.
If you think you are seeing this message by mistake and your location is not the US, kindly proceed to the website. Otherwise, you must leave the website in order to comply with government restrictions.
Why does your IP address show your location as the USA?
Please confirm whether you are a US resident or not by clicking the relevant button below. If you choose the wrong option, being a US resident, you will not be able to open an account with InstaTrade anyway.
We are sorry for any inconvenience caused by this message.