อ่านรายละเอียดเพิ่มเติม
Intermediate operational scale (Weekly)
What is expected in the weekly timeframe in the second half of 2020 from commodity instruments AUD/USD & USD/CAD & NZD/USD?____________________
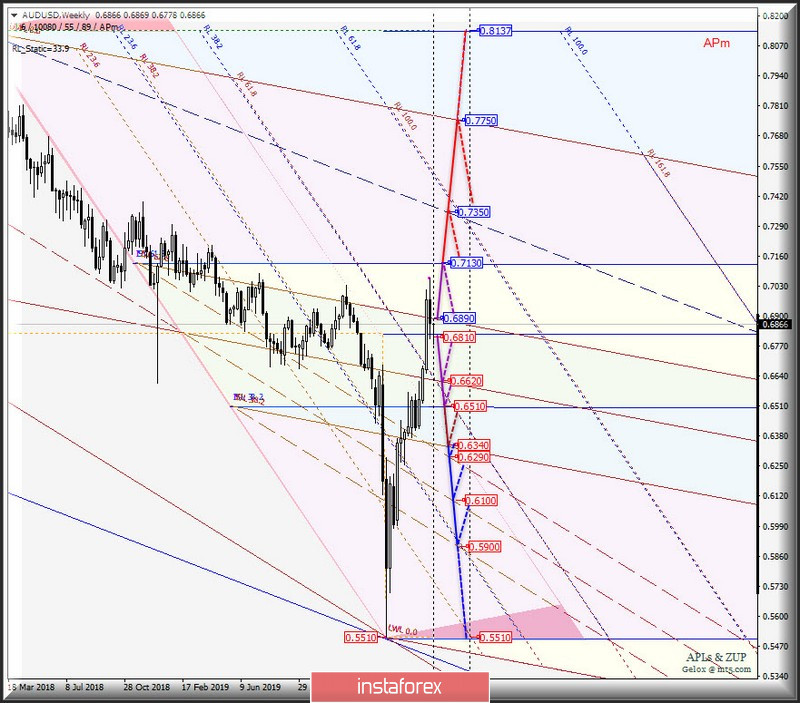
Australian dollar vs US dollar
The movement of the Australian dollar AUD/USD in the second half of 2020 will continue in the equilibrium zone (0.6510 - 0.6810 - 0.7130) of the Intermediate operational scale fork ( Weekly), taking into account the direction of the range breakdown:
The downward movement of the Australian dollar will develop as a result of the breakdown of the median Line Intermediate (Weekly) - support level of 0.6810 - and will be directed to the goals:
Median Line (0.6620) fork operational scale Minor (Daily);
The upward movement of AUD/USD will be true in the case of breakdown of the top border ISL61.8 equilibrium zone of the Minor operational scale forks (Daily) - the resistance level of 0.6890 - and can be continued to the objectives:
The AUD/USD movement options are shown on the animated chart.
____________________
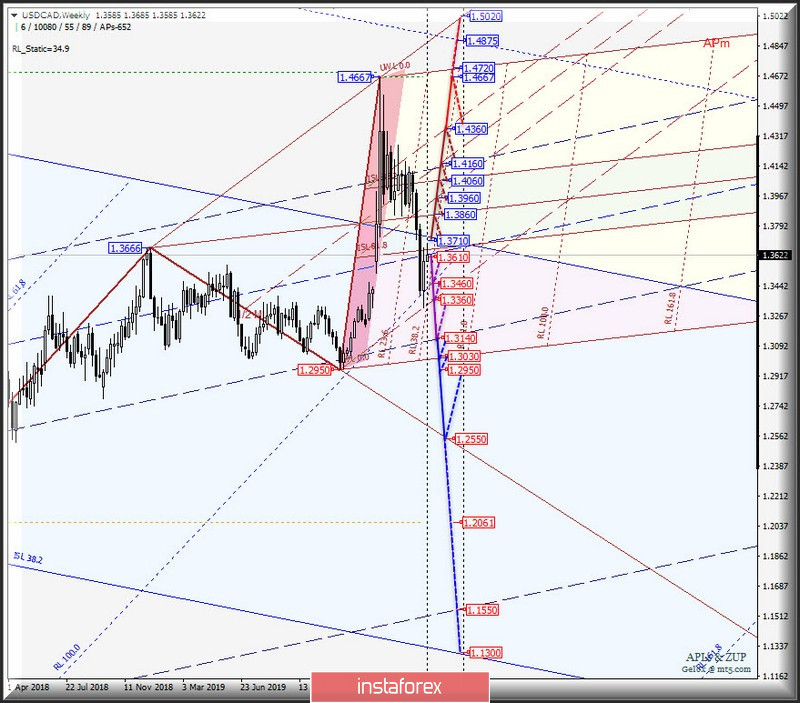
US dollar vs Canadian dollar
In the second half of 2020, the movement of the Canadian dollar (USD/CAD) will be determined by the boundaries of the 1/2 Median Line channel (1.4160 - 1.3610 - 1.3140) of the Intermediate (Weekly) operational scale fork and will depend on the direction of the range breakdown:
resistance level 1.3710 - initial line of SSL of the operational scale forks;
support level 1.3610 - 1/2 Median Line of the Intermediate (Weekly) operational scale fork.
The upward movement of the USD/CAD will be possible in case of breaking the resistance level of 1.3710 on the starting line SSL of the Intermediate (Weekly) operational scale fork and will be directed to the Median Line (1.3860) equilibrium zone of the Minor (Daily) operational scale fork and the channel borders 1/2 Median Line Minor (1.3960 - 1.4160 - 1.4360).
The downward movement of the Canadian dollar will be true in the case of breakdown of 1/2 Median Line of the Intermediate (Weekly) operational scale fork - support level 1.3610 - and may continue to objectives:
We look at the USD/CAD movement options on the animated chart.
____________________
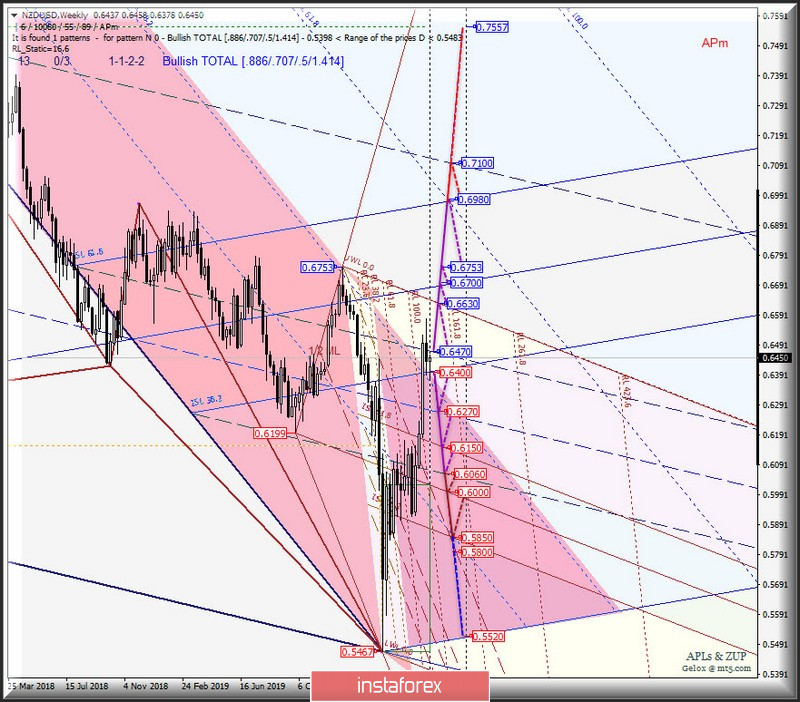
New Zealand dollar vs US dollar
The development of the movement of the New Zealand dollar (NZD/USD) in the second half of 2020 will depend on the mining zone of equilibrium (0.6400 - 0.6700 - 0.6980) of the Intermediate (Weekly) operational scale fork and will be determined by the direction of the breakout of the range:
resistance level 0.6470 - upper border of the channel 1/2 Median Line of the Intermediate (Weekly) operational scale fork;
support level 0.6400 - the lower boundary ISL38.2 equilibrium zone of the Intermediate (Weekly) operational scale fork.
The downward movement of the NZD/USD can be continued in case of breaking the lower border ISL38.2 equilibrium zone of the Intermediate (Weekly) operational scale fork - support level of 0.6400 - and will be routed to the 1/2 Median Line Intermediate (0.6270) and the borders of the zone of equilibrium (0.6150 - 0.6000 - 0.5850) of the Minor (Daily) operational scale fork.
The upward movement in the NZ dollar may get its development after the breakdown of the upper border of the channel 1/2 Median Line Intermediate (Weekly) - resistance level 0.6470 - and will come within the zone of equilibrium (0.6400 - 0.6700 - 0.6980) of the Intermediate (Weekly) operational scale fork subject to testing of the final line FSL (0.6630) of the Minor (Daily) operational scale fork and local maximum 0.6753.
The markup of the NZD/USD movement options is shown on the animated chart.
____________________
The review is compiled without taking into account the news background, the opening of trading sessions of the main financial centers and is not a guide to action (placing "sell" or "buy"orders).
You have already liked this post today
*บทวิเคราะห์ในตลาดที่มีการโพสต์ตรงนี้ เพียงเพื่อทำให้คุณทราบถึงข้อมูล ไม่ได้เป็นการเจาะจงถึงขั้นตอนให้คุณทำการซื้อขายตาม
ลิงก์ที่เป็นประโยชน์: บทความอื่นๆ ของฉันสามารถดูได้ในหมวดนี้ คอร์สเริ่มต้นสำหรับผู้เริ่มต้นของ InstaForex การวิเคราะห์ยอดนิยม เปิดบัญชีซื้อขาย สำคัญ: ผู้เริ่มต้นในตลาดฟอเร็กซ์จำเป็นต้องมีความระมัดระวังอย่างมากเมื่อทำการตัดสินใจในการเข้าสู่ตลาด ก่อนที่รายงานสำคัญจะออกมา ควรหลีกเลี่ยงการเข้าตลาดเพื่อไม่ให้พบกับความผันผวนอย่างรุนแรงจากความเปลี่ยนแปลงของตลาดที่เพิ่มขึ้น หากตัดสินใจที่จะทำการซื้อขายในช่วงที่มีการประกาศข่าว ให้ตั้งคำสั่งหยุดขาดทุนเสมอเพื่อลดความเสี่ยงในการสูญเสีย การไม่ตั้งคำสั่งหยุดขาดทุนอาจทำให้สูญเสียเงินฝากทั้งหมดอย่างรวดเร็ว โดยเฉพาะหากไม่ได้นำการจัดการเงินมาใช้งานและทำการซื้อขายในปริมาณมาก
การวิเคราะห์แนวโน้ม (รูปที่ 1): ในวันศุกร์นี้ ตลาดอาจเคลื่อนไหวขึ้นต่อเนื่องจากระดับ 1.3412 (ราคาปิดรายวันเมื่อวาน) โดยมีเป้าหมายที่ 1.3464 ซึ่งเป็นระดับการย่อตัว 23.6% (เส้นประสีแดง) เมื่อทดสอบระดับนี้แล้ว อาจมีการเคลื่อนไหวลงโดยมีเป้าหมายที่ 1.3430
วันนี้ราคาทองคำมีทิศทางปรับตัวขึ้น การเคลื่อนไหวของราคาที่เกิดขึ้นในเดือนนี้อยู่ในกรอบราคาที่เรียกว่า "รูปแบบสี่เหลี่ยม" ซึ่งบ่งบอกถึงความไม่แน่นอนของนักเทรด นอกจากนี้ ตัวบ่งชี้การแกว่งบนกราฟรายวันอยู่ใกล้กับช่วงกลาง ซึ่งบอกถึงการระมัดระวังก่อนที่จะมีการเคลื่อนทิศทางที่ชัดเจน ถ้าราคาลดลงไปอีก น่าจะพบแนวรับที่แข็งแกร่งที่เส้นค่าเฉลี่ย 50 วันใกล้ระดับ $3324 ก่อนที่จะมีโอกาสลดลงไปถึงระดับ $3300 ตัวเลขรอบที่สำคัญ
การวิเคราะห์แนวโน้ม (รูปที่ 1): ในวันศุกร์ ตลาดอาจเริ่มการเคลื่อนไหวขึ้นจากระดับ 1.1560 (ระดับการปิดรายวันเมื่อวานนี้) โดยมีเป้าหมายที่ 1.1638 ซึ่งเป็นระดับการถอยกลับ 50% (เส้นประสีเหลือง) หลังจากทดสอบระดับนี้แล้ว อาจมีการเคลื่อนไหวลงต่อ โดยเป้าหมายอยู่ที่
ในวันพฤหัสบดี คู่สกุลเงิน EUR/USD กลับมาที่ระดับ 100.0% ของการปรับตัวที่ 1.1574 และมีการดีดตัวออกจากระดับนี้เป็นครั้งที่สองติดกัน สิ่งนี้ส่งผลให้มีการกลับทิศทางในฝั่งของยูโรและเริ่มต้นการเคลื่อนไหวขึ้นใหม่ไปสู่ระดับ 1.1645 การดีดตัวจากระดับนี้จะเป็นข้อดีสำหรับดอลลาร์สหรัฐและอาจมีการกลับมาที่ 1.1574 เป็นครั้งที่สาม การยืนยันเหนือระดับ 1.1645
ในแผนภูมิรายชั่วโมง คู่สกุลเงิน GBP/USD ในวันพฤหัสบดีได้กลับมาที่โซนแนวรับ 1.3357–1.3371 และดีดตัวออกไปอีกครั้ง ส่งผลให้เกิดการกลับแนวโน้มที่มีต่อสกุลเงินอังกฤษและเริ่มต้นการเคลื่อนไหวขาขึ้นใหม่ไปยังระดับการย้อนกลับ 76.4% ที่ 1.3470 การดีดตัวครั้งที่สองจากระดับนี้จะเป็นประโยชน์ต่อสกุลเงินดอลลาร์สหรัฐอีกครั้งและการลดลงใหม่ไปยังระดับ 1.3357–1.3371 หากสามารถยืนเหนือ 1.3470 ได้จะเพิ่มความน่าจะเป็นของการเติบโตต่อเนื่องไปยังระดับ
ในช่วงต้นของเซสชั่นยุโรป ยูโรกำลังซื้อขายอยู่ราวๆ 1.1619 โดยมีการดีดตัวขึ้นหลังจากพบแนวรับที่ดีอยู่บริเวณก้นของแชนแนลดาวน์เทรนด์ที่ 1.1540 จากจุดนี้ ยูโรได้กลับเข้าสู่ช่วงขาขึ้นอีกครั้ง อย่างไรก็ตาม มีแนวโน้มว่าจะยังคงปรับตัวสูงขึ้นจนถึงแชนแนลดาวน์เทรนด์ที่ 1.1675 มีความเป็นไปได้ว่ายูโรจะยังคงปรับตัวสูงขึ้นในอีกไม่กี่วันข้างหน้า เนื่องจาก Eagle Indicator ได้ส่งสัญญาณบวก
Bitcoin ได้กลับเข้าสู่รอบการขึ้นราคาอีกครั้ง และในขณะนี้กำลังรวมตัวเหนือระดับ 6/8 ของ Murray และเหนือเส้นค่าเฉลี่ยเคลื่อนที่ 21 วัน (21SMA) เราเชื่อว่า Bitcoin อาจจะมีการขึ้นต่อไปในไม่กี่วันข้างหน้า โดยอาจจะขึ้นไปถึงระดับ 7/8
ในทางตรงกันข้าม หากราคาทองคำตกลงต่ำกว่า 3,320 และทำลายช่องแนวโน้มขาขึ้น เราอาจคาดได้ว่าจะมีการกลับตัวของแนวโน้ม และอาจลดลงไปถึงเส้น 4/8 ของ Murray ที่ 3,281 และอาจลดต่ำลงไปถึงระดับแนวรับเมื่อวันที่ 27 มิถุนายน ที่ประมาณ
อีเมล/SMS
การแจ้งเตือน
Your IP address shows that you are currently located in the USA. If you are a resident of the United States, you are prohibited from using the services of InstaFintech Group including online trading, online transfers, deposit/withdrawal of funds, etc.
If you think you are seeing this message by mistake and your location is not the US, kindly proceed to the website. Otherwise, you must leave the website in order to comply with government restrictions.
Why does your IP address show your location as the USA?
Please confirm whether you are a US resident or not by clicking the relevant button below. If you choose the wrong option, being a US resident, you will not be able to open an account with InstaTrade anyway.
We are sorry for any inconvenience caused by this message.