อ่านรายละเอียดเพิ่มเติม

 08.04.2020 01:41 AM
Minor Operational Scale (daily time frame)
We will continue to prepare options for the development of the movement of major currency instruments #USDX, EUR / USD, GBP / USD and USD / JPY (DAILY) on April 08, 2020
____________________
US dollar index
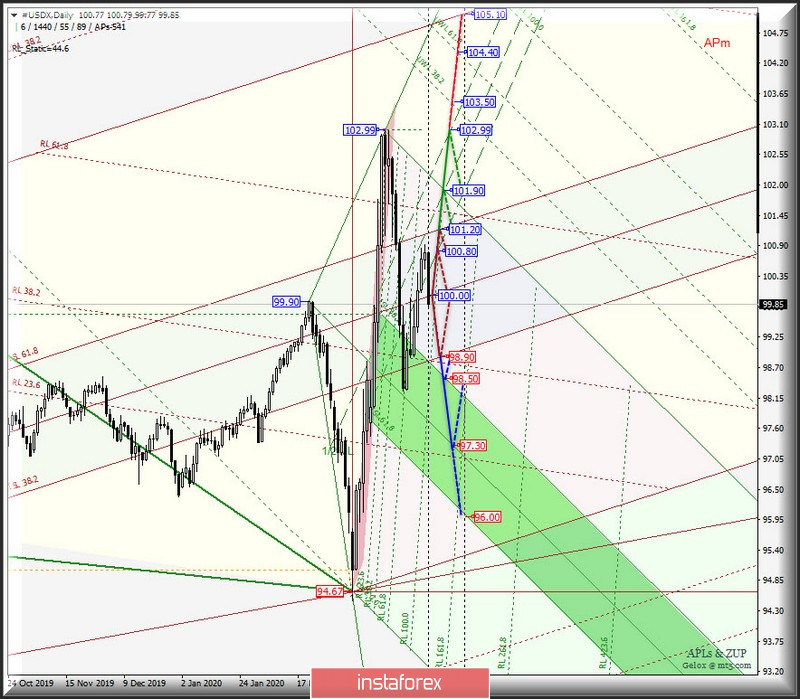
Starting April 8, 2020, the movement of the USD index #USDX will continue to develop within the equilibrium zone (98.90 - 100.00 - 101.30) of the Minor operational scale forks. The development details of the above levels are presented on the animated chart.
The breakdown of the support level of 98.90 on the lower boundary of the ISL38.2 equilibrium zone of the Minor operational scale forks will confirm the further development of the #USDX movement which will be directed to the equilibrium zone (98.50 - 97.30 - 96.00) of the Minuette operational scale forks.
On the contrary, in case of breakdown of the resistance level of 101.20 on the upper boundary of ISL61.8 equilibrium zone of the Minor operational scale forks, the development of the dollar index movement in the 1/2 Median Line channel (100.80 - 101.90 - 102.99) of the Minuette operational scale forks will be confirmed.
The movement options of #USDX on April 08, 2020 are shown on the animated chart.
____________________
Euro vs US dollar
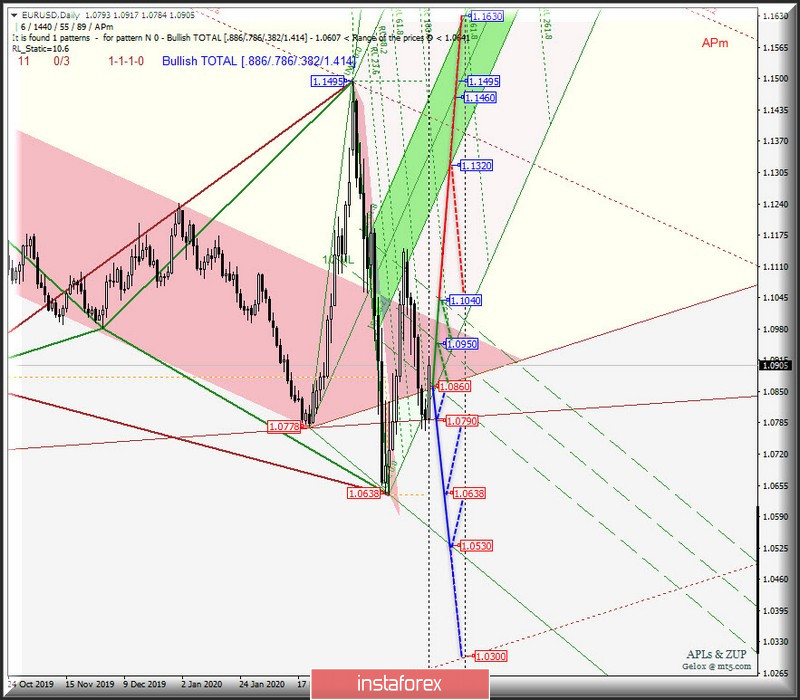
The single European currency EUR / USD from April 08, 2020 will continue to develop its movement within the 1/2 Median Line channel (1.0860 - 1.0950 - 1.1040) of the Minuette operational scale forks. The details are shown in the animated chart.
In case of breakdown of the resistance level of 1.1040 on the upper boundary of the 1/2 Median Line Minute channel, the development of the upward movement of EUR / USD can continue to the lower boundary of the ISL38.2 (1.1320) equilibrium zone of the Minuette operational scale forks.
Meanwhile, in case of breakdown of the support level 1.0860 on the lower boundary of the 1/2 Median Line channel of the Minuette operational scale forks, the downward movement of the single European currency will be directed to the targets :
- control line LTL (1.0790) of the Minor operational scale forks;
- minimum 1.0638;
- control line LTL (1.0530) of the Minuette operational scale forks.
The movement options of EUR / USD on April 08, 2020, depending on the development of the 1/2 Median Line Minuette channel, are shown on the animated chart.
____________________
Great Britain pound vs US dollar
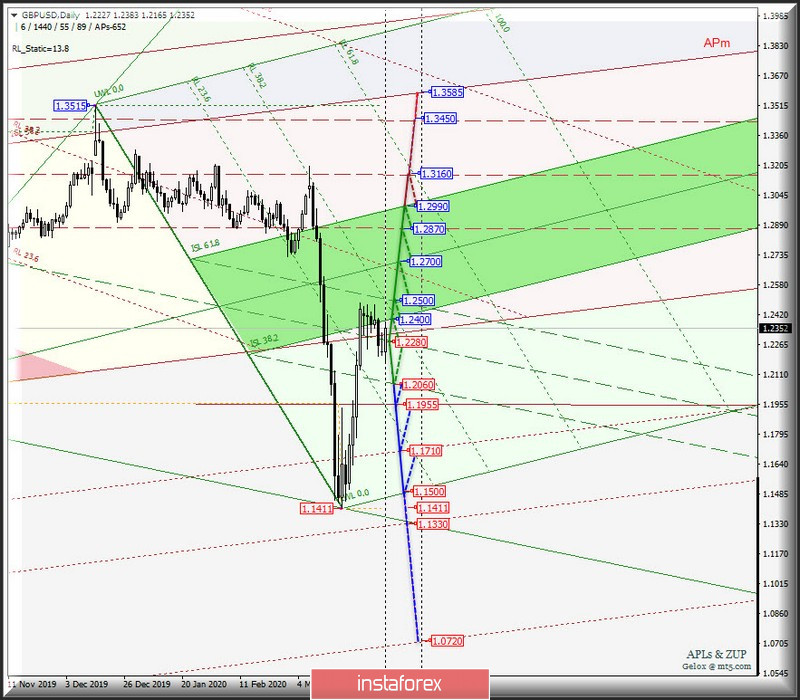
The development of Her Majesty's GBP / USD / USD currency movement from April 8, 2020 will be determined by developing the boundaries of the 1/2 Median Line channel (1.2060 - 1.2280 - 1.2500) of the Minuette operational scale forks. The traffic marking details for this channel is shown on the animated chart.
The breakdown of the resistance level 1.2500 on the upper boundary of the 1/2 Median Line Minuette channel will confirm the further development of Her Majesty's currency movement in the equilibrium zone (1.2400 - 1.2700 - 1.2990) of the Minuette operational scale forks with the possibility of continuing this already in the 1/2 Median Line channel (1.2870 - 1.3160 - 1.3450) of the Minor operational scale forks.
Alternatively, if there will be a breakdown of the support level 1.2060 on the lower boundary of the 1/2 Median Line channel of the Minuette operational scale forks, then the downward movement of GBP / USD can be directed to the targets:
- control line LTL of the Minor operational scale forks (1.1955) ;
- warning line LWL38.2 Minor (1.1710);
- Starting line SSL Minuette (1.1500).
The movement options of GBP / USD on April 08, 2020 are shown on the animated chart.
____________________
US dollar vs Japanese yen
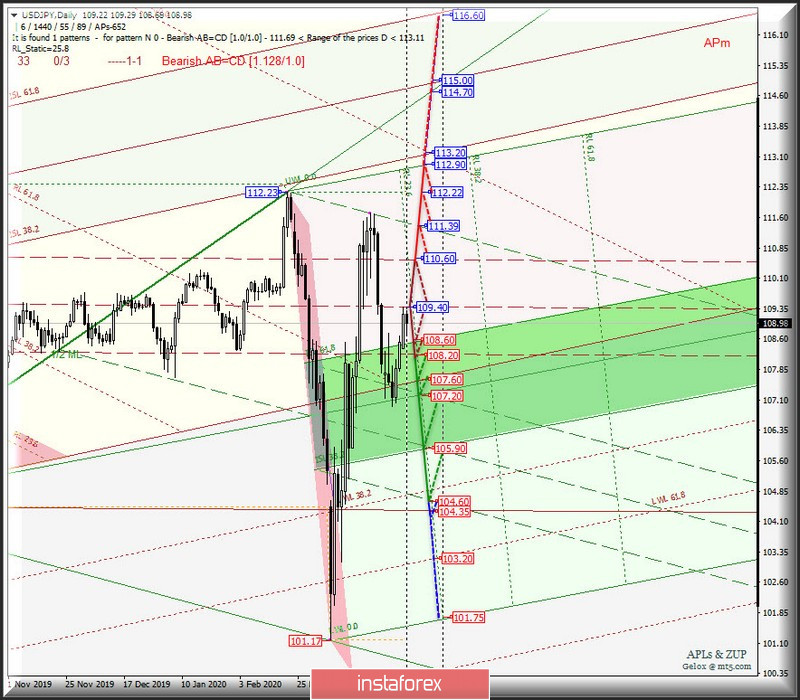
The development and direction of the breakdown of the boundaries of 1/2 Median Line channel (108.20 - 109.40 - 110.60) of the Minor operational scale forks will determine the development of the USD / JPY currency movement on April 08, 2020. The details of testing the above levels is presented on the animated chart.
In case of breakdown of the support level of 108.20 on the lower boundary of the 1/2 Median Line channel of the Minor operational scale forks, the development of the currency of the "country of the rising sun" will continue to be confirmed within the boundaries of the equilibrium zone (108.60 - 107.20 - 105.90) and 1/2 Median Line channel (107.20 - 105.90 - 104.60) of the Minuette operational scale forks.
In contrast, in case of breakdown of the resistance level 110.60 on the upper boundary of the 1/2 Median Line channel of the Minor operational scale forks, the upward movement of USD / JPY can be continued to the goals :
- final Shift Line Minuette (111.39);
- maximum 112.22;
- final line FSL (112.90) of the Minuette operational scale forks
The movement options of USD / JPY on April 08, 2020 are shown on the animated chart.
____________________
The review was compiled without taking into account the news background. Thus, the opening trading sessions of major financial centers does not serve as a guide to action (placing orders "sell" or "buy").
The formula for calculating the dollar index :
USDX = 50.14348112 * USDEUR0.576 * USDJPY0.136 * USDGBP0.119 * USDCAD0.091 * USDSEK0.042 * USDCHF0.036.
where the power coefficients correspond to the weights of the currencies in the basket:
Euro - 57.6% ;
Yen - 13.6% ;
Pound Sterling - 11.9% ;
Canadian dollar - 9.1%;
Swedish krona - 4.2%;
Swiss franc - 3.6%.
The first coefficient in the formula leads the index to 100 at the starting date - March 1973, when the main currencies began to be freely quoted relative to each other.


