empty
13.12.2019 10:16 AM
Technical analysis recommendations for EUR/USD and GBP/USD on December 13

Technical analysis recommendations for EUR / USD and GBP / USD on December 13

Economic calendar (Universal time)

The pound's expectations came true. Boris Johnson and his government received an instruction to implement Brexit. The market quickly hit this news, and the bulls managed to fly to new heights. Meanwhile, in today's economic calendar, important statistics are not dominant again. We can only note data on retail sales in the USA (13:30).

EUR / USD

This image is no longer relevant

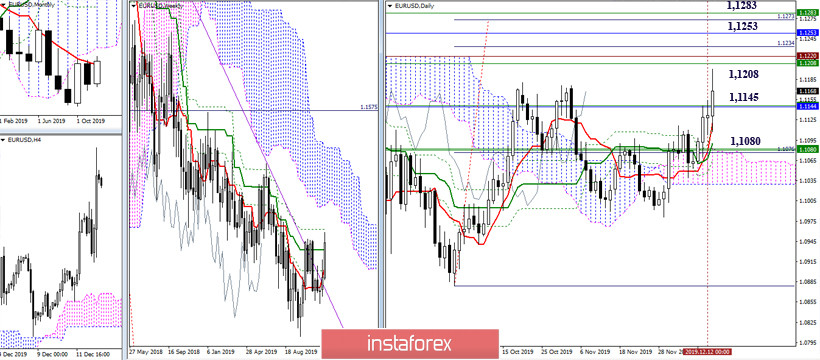
Yesterday, the players on the upside were not able to break through the important levels at 1.1145 (weekly Kijun + monthly Tenkan), but today, this did not prevent them from leaving these levels behind and into the tight approach to the next resistance zone. The resistance zone encountered is quite wide and concentrates many significant targets. To pass it, players on the upside will first have to eliminate the weekly dead cross (1.1208 Fibo Kijun), then work out the daily target for the breakdown of the cloud (1.1234-73) and meet the lower boundaries of the clouds 1.1253 ( monthly cloud) and 1.1283 (weekly cloud). The role of immediate support in this situation belongs to 1.1145 (weekly Kijun + monthly Tenkan) and 1.1080 (weekly levels + daily Kijun + upper boundary of the daily cloud).

This image is no longer relevant

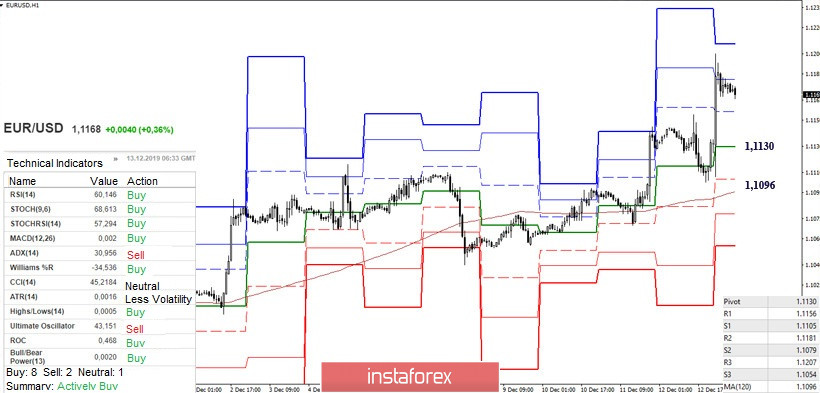
In the lower halves, the pair has already completed the rise to the zone of influence of the final resistance of the classic pivot levels (1.1207) today. I think that no significant new results are expected in the course of the day. Most likely, the day and closing of the week will take place at approximately the designated boundaries. At the moment, key support on H1 is located at 1.1130 (central pivot level) and 1.1096 (weekly long-term trend).

GBP / USD

This image is no longer relevant

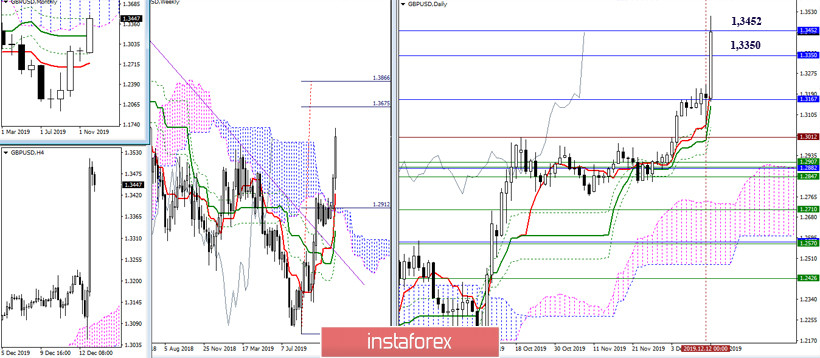
Yesterday, players on the upside still allowed the opponent to perform a full correction to the daily short-term trend (1.3062), but this was limited and used support for a new take-off. As a result, two monthly levels were tested today - 1.3350 (the lower boundary of the monthly cloud) and 1.3452 (the final boundary of the monthly dead cross). Breaking through these levels will open the way to the fulfillment of the goal for the breakdown of the weekly cloud (1.3675 - 1.3866).

This image is no longer relevant

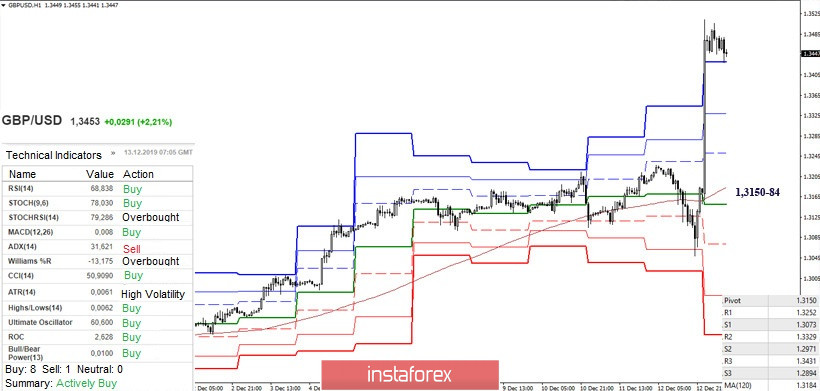
Today's performance has already broken many records, so closing the current day and week is unlikely to bring new shocks. Now, support can have more value. Today, key levels on H1 are located in the region of 1.3150-84 (weekly long-term trend + central pivot level), while intermediate levels can be noted at 1.3431 (R3) - 1.3329 (R2) - 1.3225 (R1).

Ichimoku Kinko Hyo (9.26.52), Pivot Points (classic), Moving Average (120)


Recommended Stories

XAU/USD: การวิเคราะห์และพยากรณ์

ในวันจันทร์ที่ผ่านมา การลดลงระหว่างวันได้ดันราคาทองคำต่ำกว่าระดับ 3365 แต่เครื่องมือ Oscillator ในกราฟรายวันยังไม่เริ่มแสดงแรงเชิงลบ ซึ่งบ่งชี้ว่าโลหะมีค่านี้อาจพบแนวรับที่ 3350 หรือที่เส้นค่าเฉลี่ยเคลื่อนที่ 50 วัน อย่างไรก็ตาม หากราคาทะลุต่ำกว่าระดับนี้อย่างชัดเจน อาจกลายเป็นสัญญาณให้ผู้ขายเริ่มทยอยขาย ทำให้ราคา

Irina Yanina 19:34 2025-08-11 UTC+2

สัญญาณการซื้อขายสำหรับ EUR/USD ระหว่างวันที่ 11-15 สิงหาคม 2025: ขายต่ำกว่า 1.1650 (200 EMA - 7/8 Murray)

ในช่วงต้นของตลาดอเมริกา ยูโรมีการซื้อขายอยู่รอบๆ 1.1590 หลังจากที่เกิดการพยายามทะลุแนวโน้มขาลงไม่สำเร็จ EUR/USD ลดลงต่ำกว่า 21 SMA และต่ำกว่า 7/8 Murray ให้มุมมองเป็นขาลง ยูโรอยู่ต่ำกว่า

Dimitrios Zappas 17:54 2025-08-11 UTC+2

สัญญาณการเทรดทองคำ (XAU/USD) สำหรับวันที่ 11-15 สิงหาคม 2025: ขายเมื่อราคาต่ำกว่า $3,380 หรือซื้อหากราคาดีดกลับที่ $3,341 (21 SMA - 7/8 Murray)

ทองคำเริ่มการซื้อขายของสัปดาห์นี้ต่ำกว่าระดับ Murray 7/8 ที่ 3,398 และจากจุดนั้นเกิดการปรับฐานทางเทคนิค การดีดกลับทางเทคนิคมีแนวโน้มว่าจะอยู่รอบๆ ระดับ 3,384 ซึ่งเป็นเขตช่องทางขาขึ้น หากทองคำดีดกลับจากบริเวณนี้ จะถูกมองว่าเป็นโอกาสในการซื้อโดยมีเป้าหมายที่ 3,425 ในทางกลับกัน หากทองคำหลุดกรอบ

Dimitrios Zappas 17:51 2025-08-11 UTC+2

การคาดการณ์สำหรับ EUR/USD วันที่ 11 สิงหาคม 2025

เมื่อวันศุกร์ที่ผ่านมา EUR/USD ทำการฟื้นตัวขึ้นสองครั้งจากโซนแนวรับ 1.1637–1.1645 และหันไปในทางที่เพิ่มขึ้นของยูโร ซึ่งหมายความว่าการเคลื่อนไหวขึ้นอาจดำเนินต่อไปในวันนี้ มุ่งสู่ระดับ Fibonacci retracement ที่ 76.4% ที่ 1.1695 การคงอยู่ต่ำกว่าโซน 1.1637–1.1645

Samir Klishi 10:44 2025-08-11 UTC+2

การพยากรณ์ค่าเงิน GBP/USD สำหรับวันที่ 11 สิงหาคม 2025

ในกราฟรายชั่วโมง GBP/USD ในวันศุกร์มีการกระเด้งสองครั้งจากระดับ 1.3425 และในวันจันทร์ยังคงเคลื่อนไหวขึ้นไปสู่ระดับแนวต้านที่ 76.4% ที่ 1.3470 การกระเด้งจากระดับนี้จะเป็นผลดีต่อดอลลาร์สหรัฐและการดึงกลับไปที่ระดับ 1.3425 และโซนแนวรับที่ 1.3357–1.3371 การยืนที่ระดับเหนือ 1.3470 จะเพิ่มโอกาสให้การเติบโตต่อไปสู่ระดับ

Samir Klishi 10:25 2025-08-11 UTC+2

การคาดการณ์ตลาด Forex 11/08/2025: EUR/USD, USD/JPY, GBP/USD, Gold, Ethereum และ Bitcoin

ลิงก์ที่เป็นประโยชน์: บทความอื่น ๆ ของฉันที่มีให้ในส่วนนี้ คอร์สสำหรับผู้เริ่มต้นกับ InstaForex การวิเคราะห์ที่ได้รับความนิยม เปิดบัญชีซื้อขาย สำคัญ: ผู้เริ่มต้นในการซื้อขายฟอเร็กซ์ต้องระมัดระวังอย่างมากในการตัดสินใจเข้าสู่ตลาด ก่อนที่รายงานสำคัญจะถูกเผยแพร่ ควรหลีกเลี่ยงที่จะเข้าตลาด เพื่อหลีกเลี่ยงการเผชิญกับความผันผวนของตลาดที่สูงขึ้น หากคุณตัดสินใจที่จะซื้อขายในระหว่างการปล่อยข่าว ควรตั้งคำสั่งหยุด

Sebastian Seliga 10:20 2025-08-11 UTC+2

GBP/USD. การวิเคราะห์ทางเทคนิคสำหรับสัปดาห์ที่ 11–16 สิงหาคม

การวิเคราะห์แนวโน้ม ในสัปดาห์นี้ จากระดับ 1.3450 (ใกล้ระดับราคาปิดของเทียนสัปดาห์ก่อนหน้า) ราคามีโอกาสที่จะเริ่มเคลื่อนตัวลดลงไปทดสอบระดับ 1.3270 ซึ่งเป็นจุดระดับสนับสนุนทางประวัติศาสตร์ (เส้นประสีน้ำเงิน) เมื่อทดสอบระดับนี้แล้ว ราคามีโอกาสเคลื่อนตัวต่อไปยังระดับ 1.3141 ซึ่งเป็นระดับการถอยกลับ 38.2% (เส้นประสีแดง)

Stefan Doll 10:02 2025-08-11 UTC+2

EUR/USD. การวิเคราะห์ทางเทคนิคสำหรับสัปดาห์ที่ 11–16 สิงหาคม

การวิเคราะห์แนวโน้ม (รูปที่ 1) ในสัปดาห์นี้ จากระดับ 1.1641 (ใกล้เคียงกับแท่งเทียนรายสัปดาห์ล่าสุด) ตลาดอาจเริ่มเคลื่อนไหวลงสู่ระดับ 1.1448 – แนวระดับการคืนกลับ 50% (เส้นประสีน้ำเงิน) เมื่อทดสอบระดับนี้ ราคาอาจเริ่มเคลื่อนไหวขึ้นสู่ระดับ

Stefan Doll 09:55 2025-08-11 UTC+2

GBP/USD: การวิเคราะห์ตัวบ่งชี้ในวันที่ 11 สิงหาคม 2025

การวิเคราะห์แนวโน้ม (รูปที่ 1) ในวันจันทร์ ตั้งแต่ระดับ 1.3450 (จากการปิดของแท่งเทียนประจำวันในวันศุกร์) ตลาดอาจมีการเคลื่อนไหวขึ้นต่อไปที่ระดับ 1.3481 ซึ่งเป็นระดับการปรับฐาน 76.4% (เส้นประสีแดง) เมื่อทดสอบระดับนี้แล้ว ราคาอาจเริ่มมีการเคลื่อนไหวลงมาที่ระดับ 1.3416

Stefan Doll 09:53 2025-08-11 UTC+2

EUR/USD. การวิเคราะห์ตัวชี้วัดเมื่อวันที่ 11 สิงหาคม 2025

การวิเคราะห์แนวโน้ม (รูปที่ 1) ในวันจันทร์ จากระดับ 1.1641 (ระดับปิดของกราฟเทียนในวันศุกร์) ตลาดอาจเริ่มเคลื่อนไหวขึ้นไปยัง 1.1689 ซึ่งเป็นระดับแนวต้านทางประวัติศาสตร์ (เส้นประสีน้ำเงิน) เมื่อทดสอบระดับนี้ ราคามีแนวโน้มที่จะเริ่มเคลื่อนตัวลงไปที่ 1.1653 ซึ่งเป็นระดับการย้อนกลับ

Stefan Doll 09:40 2025-08-11 UTC+2
หากไม่สะดวกคุยในตอนนี้
ระบุคำถามไว้ได้ใน แชท.
 

Dear visitor,

Your IP address shows that you are currently located in the USA. If you are a resident of the United States, you are prohibited from using the services of InstaFintech Group including online trading, online transfers, deposit/withdrawal of funds, etc.

If you think you are seeing this message by mistake and your location is not the US, kindly proceed to the website. Otherwise, you must leave the website in order to comply with government restrictions.

Why does your IP address show your location as the USA?

  • - you are using a VPN provided by a hosting company based in the United States;
  • - your IP does not have proper WHOIS records;
  • - an error occurred in the WHOIS geolocation database.

Please confirm whether you are a US resident or not by clicking the relevant button below. If you choose the wrong option, being a US resident, you will not be able to open an account with InstaTrade anyway.

We are sorry for any inconvenience caused by this message.