
Lihat juga


 27.07.2026 09:42 AM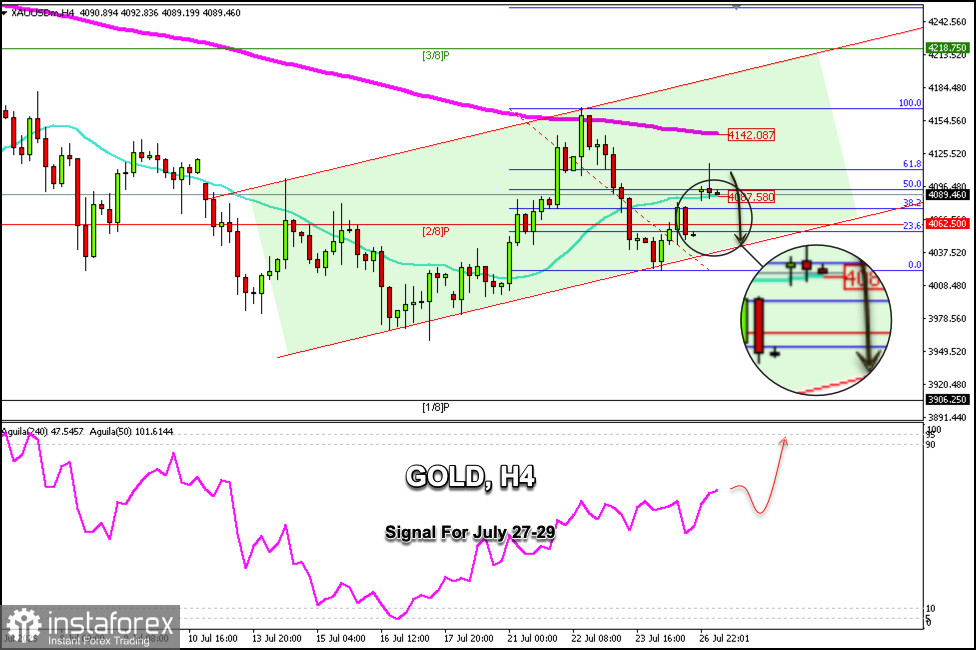
Gold is trading around $4,089 after reaching the 61.8% Fibonacci level around $4,117 and is now pulling back. On the H4 chart, we can see that gold left a gap around the $4,052 level, which is below the Murray 2/8 level. This suggests that gold is likely to continue falling in the coming days.
If, in the coming hours, gold falls below $4,087—where the 21 SMA is located—this could be interpreted as a bearish sell signal, with targets at the 2/8 Murray level, around $4,062. Ultimately, we expect it to close the gap and reach the lower band of the uptrend channel, around $4,040.
Since the trend for gold remains bullish, as indicated by the Eagle indicator, we could look for buying opportunities if the price consolidates above $4,080. Alternatively, a bounce around the 2/8 Murray level could be considered an opportunity to open long positions, with targets at the 200 EMA level, around $4,142.
If the downtrend continues and the price consolidates below the 61.8% Fibonacci level, we could expect it to reach the psychological level of $4,000 in the coming days and eventually reach the Murray 1/8 level, around $3,906.
You have already liked this post today
* Analisis pasaran yang disiarkan di sini adalah bertujuan untuk meningkatkan kesedaran anda, tetapi tidak untuk memberi arahan untuk membuat perdagangan.


