empty
28.03.2025 11:36 AM
GBP/USD. March 28th. Disappointing Results from the British Economy

On the hourly chart, the GBP/USD pair on Thursday rebounded from the 1.2865 level, reversed in favor of the pound, and rose above the 1.2931 level, which carries no weight under horizontal market conditions. Today, the upward movement continues toward the 127.2% Fibonacci level at 1.3003, although the news background has been more supportive of bears. However, the bears remain very weak, especially following Donald Trump's new tariffs.

This image is no longer relevant

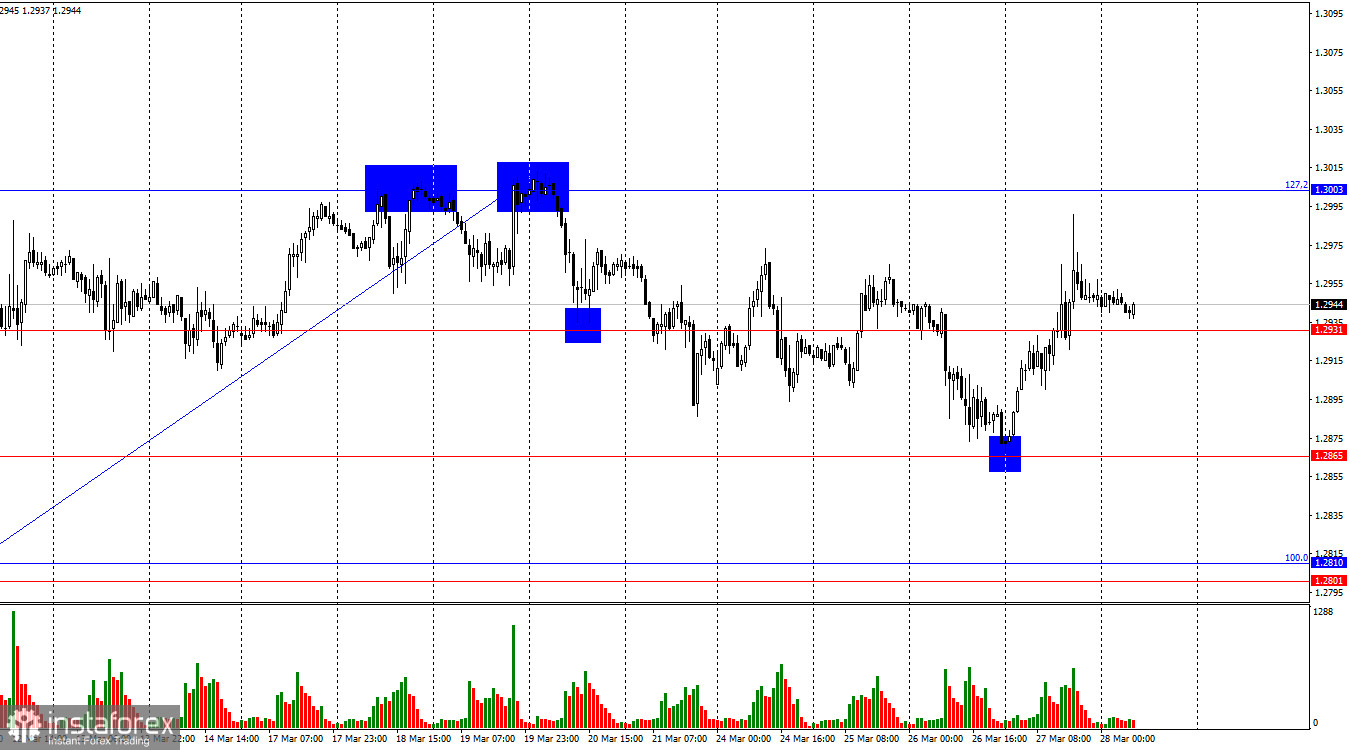
The wave structure is absolutely clear. The last completed downward wave did not break the previous low, while the last upward wave exceeded the previous high. This indicates the continuation of a "bullish" trend. The pound has shown very strong growth lately, although the news background has not been strong enough to justify such aggressive buying. Yet most traders are unwilling to buy the dollar regardless of economic data, as Donald Trump continues to impose new tariffs that could eventually harm U.S. economic growth and that of many other countries.

The news background on Thursday undeniably supported the bulls. On Friday morning, the UK released two reports that, in my opinion, did not carry any real positive weight for the pound. Retail sales volumes in February rose by 1% m/m and 2.2% y/y, significantly above trader expectations. At the same time, UK GDP showed a 0.1% q/q and 1.5% y/y increase. I view these as relatively weak figures, though they did slightly exceed forecasts. Thus, bulls have received support from news for the second day in a row, but the overall state of the UK economy still raises many questions. The pound's ongoing growth also appears increasingly anomalous. Since March 6, the pair has been trading between 1.2865 and 1.3003, making it more reasonable to consider the current trend a sideways channel. However, with such news, the bulls could quickly break through the 1.3003 level.

This image is no longer relevant

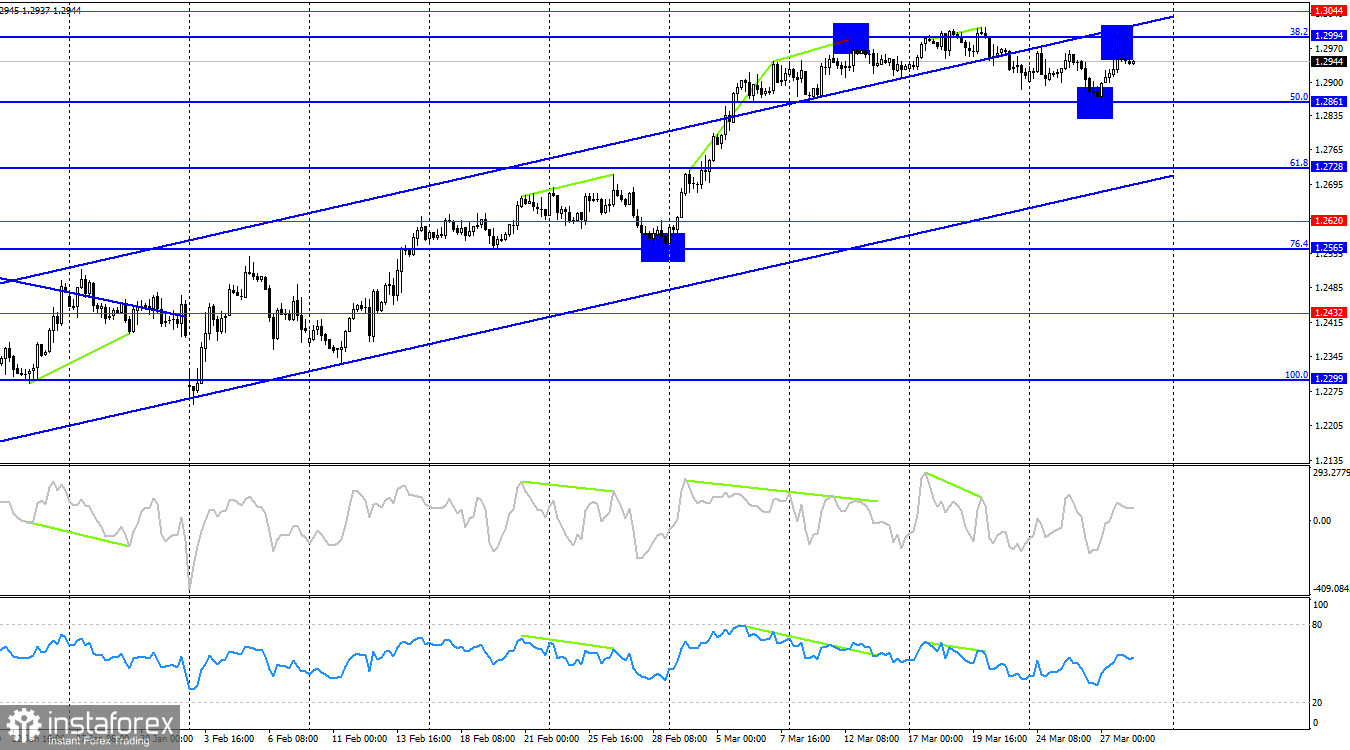
On the 4-hour chart, the pair continues its upward movement. I do not expect a strong decline in the pound until the quotes close below the ascending channel. A rebound from the 38.2% Fibonacci level at 1.2994 could work in favor of the dollar and lead to a decline toward the 50.0% retracement level at 1.2861. However, I believe the recent drop has been too weak to reestablish a "bullish" trend immediately. A firm hold above the 1.2994 level would increase the likelihood of further gains.

Commitments of Traders (COT) Report:

This image is no longer relevant

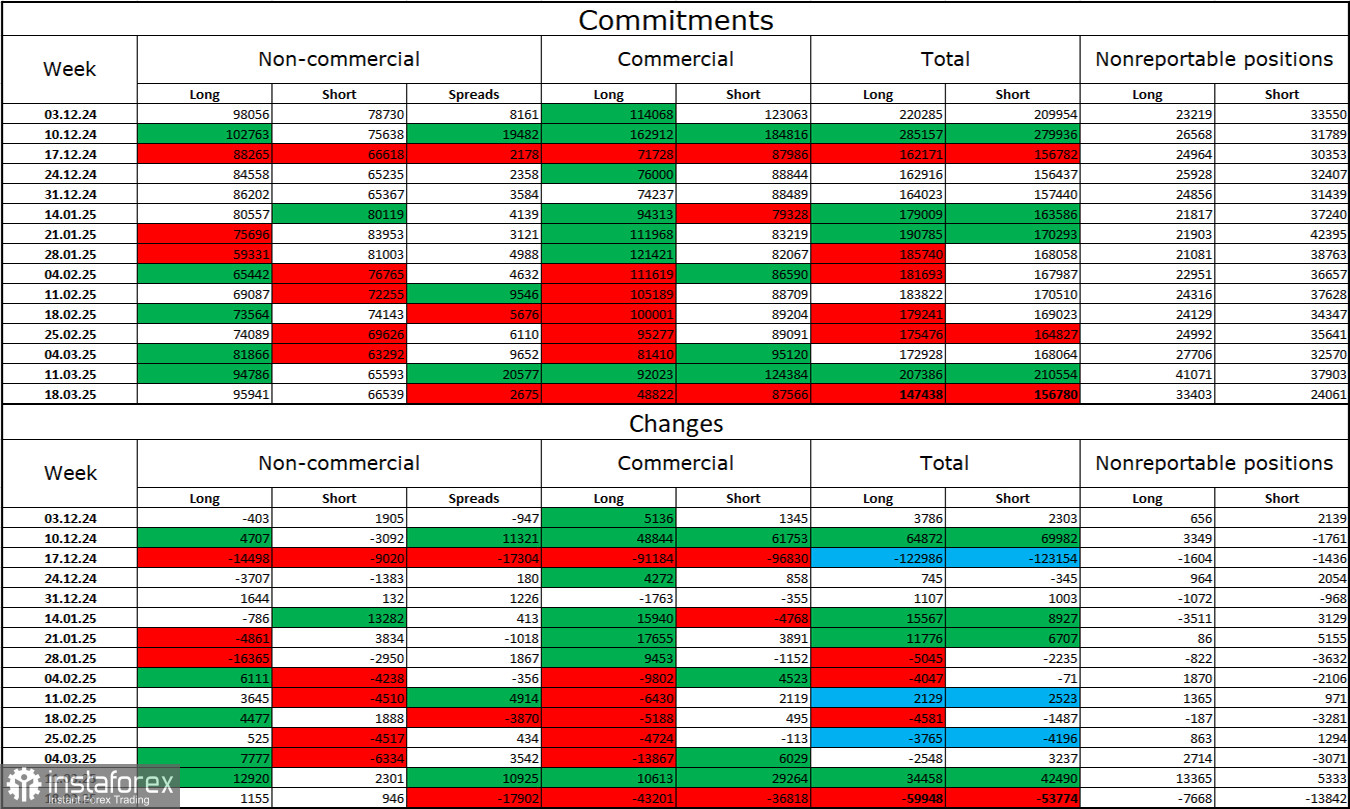
Sentiment among the "Non-commercial" trader category became more "bullish" over the last reporting week. The number of long positions held by speculators increased by 1,155, while short positions rose by only 946. Bears have lost their advantage in the market. The gap between long and short positions now favors the bulls by nearly 30,000: 96,000 vs. 67,000.

In my opinion, the pound still has downside potential, but recent developments could trigger a long-term market reversal. Over the last 3 months, long positions have decreased from 98,000 to 96,000, and shorts from 78,000 to 67,000. More importantly, over the past 7 weeks, long positions have grown from 59,000 to 96,000, while shorts have fallen from 81,000 to 67,000. I'd like to remind you—these have been "7 weeks under Trump's rule"...

News Calendar for the U.S. and the UK:

UK – Retail Sales Change (07:00 UTC) UK – GDP Change (07:00 UTC) US – Personal Consumption Expenditures Price Index (12:30 UTC) US – Personal Income and Spending (12:30 UTC) US – University of Michigan Consumer Sentiment Index (14:00 UTC)

Friday's economic calendar includes five entries, with the two most important already released. The impact of the news background on market sentiment in the second half of the day may be moderate.

GBP/USD Forecast and Trader Tips:

Selling the pair was possible after a rebound from the 1.3003 level on the hourly chart with targets at 1.2931 and 1.2865. All targets were met. Buying opportunities were present upon a firm hold above 1.2931 on the hourly chart or a rebound from 1.2865. Currently, the movement is largely horizontal, so a solid break above 1.3003 will be difficult for the bulls today.

Fibonacci levels are plotted from 1.2809 to 1.2100 on the hourly chart and from 1.2299 to 1.3432 on the 4-hour chart.

Recommended Stories

GBP/USD. Analisis Penunjuk pada 17 Julai

Pada hari Rabu, pasangan ini telah bergerak menaik (berdasarkan berita), mencapai Purata Bergerak Eksponen (EMA) 8-tempoh pada paras 1.3489 (garis biru nipis), sebelum mengalami penurunan dan menutup lilin harian pada

Stefan Doll 12:12 2025-07-17 UTC+2

EUR/USD. Analisis Penunjuk pada 17 Julai

Pada hari Rabu, pasangan ini bergerak ke atas (berdasarkan berita), mencapai tahap 23.6% pada 1.1739 (garisan putus-putus kuning), dan kemudian menurun, menutup graf lilin harian pada 1.1639. Hari

Stefan Doll 11:45 2025-07-17 UTC+2

EUR/USD. 17 Julai. Trump Ingin Pecat Powell Sekali Lagi

Pada hari Rabu, pasangan EUR/USD telah mencapai paras pembetulan 100.0% pada 1.1574, membuat lantunan dari paras tersebut dan meningkat ke paras Fibonacci 127.2% pada 1.1712, sebelum kembali membuat lantunan menurun

Samir Klishi 11:23 2025-07-17 UTC+2

GBP/USD. 17 Julai. Pengangguran di UK Terus Meningkat

Dalam carta setiap jam, pasangan GBP/USD telah membuat lantunan semula pada hari Rabu dari zon sokongan 1.3357–1.3371 dan naik ke paras pembetulan 76.4% pada 1.3470. Lantunan dari 1.3470 membawa kepada

Samir Klishi 11:15 2025-07-17 UTC+2

DXY berpotensi untuk menguji tahap pivotnya, namun terdapat kemungkinan untuk pengukuhan lanjut pada hari Khamis, 17 Julai 2025.

Indeks Dolar AS – Khamis, 17 Julai 2025 Jika tahap pivot dan sokongan mampu menahan pembetulan kelemahan #USDX dalam jangka masa terdekat, #USDX berpotensi untuk terus mengukuh, disokong oleh Golden

Arief Makmur 08:47 2025-07-17 UTC+2

Indeks Nasdaq 100 Berpotensi Melemah dan Jatuh ke Paras Sokongan Terdekat pada Khamis, 17 Julai 2025

Indeks Nasdaq 100 – Khamis, 17 Julai 2025 Pergerakan harga #NDX berada di bawah EMA(20) dan EMA(50), disokong oleh bacaan RSI(14) yang berada pada tahap penurunan Harga neutral. Oleh demikian

Arief Makmur 08:47 2025-07-17 UTC+2

Jangkaan Kejatuhan Pasaran Saham Menerusi Lensa Kadar Silang EUR/JPY

Secara sejarahnya, peralihan pelabur dari pasaran saham lazimnya tercermin dalam penurunan pasangan EUR/JPY, kerana ia merangkumi pengalihan dana dari mata wang berisiko (seperti euro) kepada aset selamat (seperti dolar

Laurie Bailey 07:41 2025-07-17 UTC+2

Isyarat Dagangan EMAS (XAU/USD) untuk 17-21 Julai 2025: beli melebihi $3,329 (200 EMA - 5/8 Murray)

Emas diniagakan sekitar 3,335, melantun semula selepas mencapai paras terendah 3,320 dan tertinggi 3,377 semalam semasa sesi dagangan Amerika. Emas mencatatkan volatiliti yang tinggi susulan kenyataan Presiden Amerika Syarikat, Donald

Dimitrios Zappas 05:58 2025-07-17 UTC+2

Isyarat Dagangan untuk BITCOIN bagi 17-21 Julai, 2025: beli di atas 118,750 (200 EMA - 6/8 Murray)

Jika harga Bitcoin jatuh di bawah paras 5/8 Murray pada 115.625, iaitu paras terendah pada 14 Julai, kita boleh menjangkakan ia mencapai 200 EMA, yang terletak sekitar paras psikologi $110,000

Dimitrios Zappas 05:56 2025-07-17 UTC+2

Isyarat Dagangan untuk EUR/USD bagi 17-21 Julai, 2025: beli di atas 1.1611 (200 EMA - 7/8 Murray)

Sebaliknya, jika euro jatuh di bawah 1.1600, kita boleh menjangkakan ia mencapai sokongan mingguan sekitar 1.1550. Tahap ini juga boleh dilihat sebagai peluang membeli, kerana carta H4 menunjukkan euro menunjukkan

Dimitrios Zappas 05:53 2025-07-17 UTC+2
Tidak boleh bertanya sekarang?
Tanya soalan anda di Ruangan bersembang.
 

Dear visitor,

Your IP address shows that you are currently located in the USA. If you are a resident of the United States, you are prohibited from using the services of InstaFintech Group including online trading, online transfers, deposit/withdrawal of funds, etc.

If you think you are seeing this message by mistake and your location is not the US, kindly proceed to the website. Otherwise, you must leave the website in order to comply with government restrictions.

Why does your IP address show your location as the USA?

  • - you are using a VPN provided by a hosting company based in the United States;
  • - your IP does not have proper WHOIS records;
  • - an error occurred in the WHOIS geolocation database.

Please confirm whether you are a US resident or not by clicking the relevant button below. If you choose the wrong option, being a US resident, you will not be able to open an account with InstaTrade anyway.

We are sorry for any inconvenience caused by this message.