Lihat juga

 04.11.2023 08:49 PM
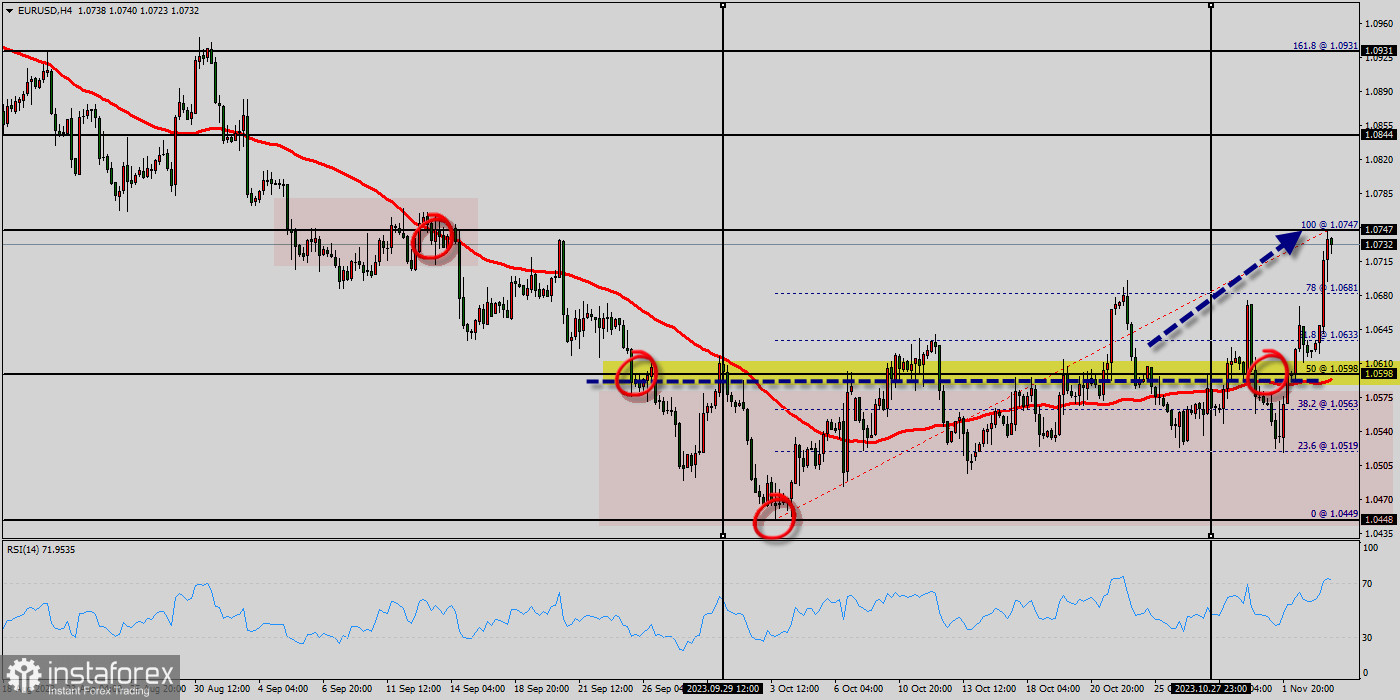
Overview :
The trend of EUR/USD pair movement was controversial as it took place in the downtrend channel. Due to the previous events, the price is still set between the levels of 1.0850 and 1.0773, so it is recommended to be careful while making deals in these levels because the prices of 1.0850 and 1.0773 are representing the resistance and support respectively.
Therefore, it is necessary to wait till the downtrend channel is passed through. Then the market will probably show the signs of a bearish market. In other words, sell deals are recommended below the price of 1.0850 with the first target at the level of 1.08000. From this point, the pair is likely to begin an descending movement to the price of 1.0770 with a view to test the daily support at 1.0770.
The US Dollar has been losing ground against some of its major counterparts, such as the Euro and British Pound. In response, retail traders have been responding by decreasing downside exposure in the US Dollar currency. The EUR/USD pair will continue rising from the level of 1.0712 today.
So, the support is found at the level of 1.0712, which represents the 50% Fibonacci retracement level in the H1 time frame. Since the trend is above the 50% Fibonacci level, the market is still in an uptrend. With that in mind, is there more room for the Euro to rally? On the hourly chart, the EUR/USD pairis showing signs of an increasingly bullish technical bias. Prices have broken under the rising trendline from September. Meanwhile, a bullish between the 50- and 100-day Simple Moving Averages is present (SMA).
Currently, prices are idling just under the 1.0700 and 1.0715 inflection zone. Key support below is the 50% Fibonacci retracement level at 1.0712. In the event of a turn higher, the moving averages may hold as key resistance, maintaining the upside focus. The EUR/USD pair has faced strong support at the level of 1.0712 because resistance became support.
So, the strong resistance has been already faced at the level of 1.0788 and the pair is likely to try to approach it in order to test it again. The level of 1.0712 represents a weekly pivot point for that it is acting as minor support this week. Furthermore, the EUR/USD pair is continuing to trade in a bullish trend from the new support level of 1.0712.
Currently, the price is in a bullish channel. According to the previous events, we expect the EUR/USD pair to move between 1.0712 and 1.0814. Also, it should be noticed that the double top is set at 1.0788. Additionally, the RSI is still signaling that the trend is upward as it remains strong above the moving average (100).
This suggests the pair will probably go up in coming hours. Accordingly, the market is likely to show signs of a bullish trend. In other words, buy orders are recommended above 1.0712 with the first target at the level of 1.0788. If the trend is be able to break the double top at the level of 1.0788, then the market will continue rising towards the weekly resistance 1 at 1.0814.
However, the price spot of 1.0814 remains a significant resistance zone. Thus, the trend will probably be rebounded again from the double top as long as the level of 1.0814 is not breached. The market is still in an uptrend. We still prefer the bullish scenario.
Forecast :
If the pair fails to pass through the level of 1.0850, the market will indicate a bearish opportunity below the strong resistance level of 1.0850. In this regard, sell deals are recommended lower than the 1.0850 level with the first target at 1.0800. It is possible that the pair will turn downwards continuing the development of the bearish trend to the level 1.0770. However, stop loss has always been in consideration thus it will be useful to set it above the last double top at the level of 1.0910 (notice that the major resistance today has set at 1.0850).


