Lihat juga
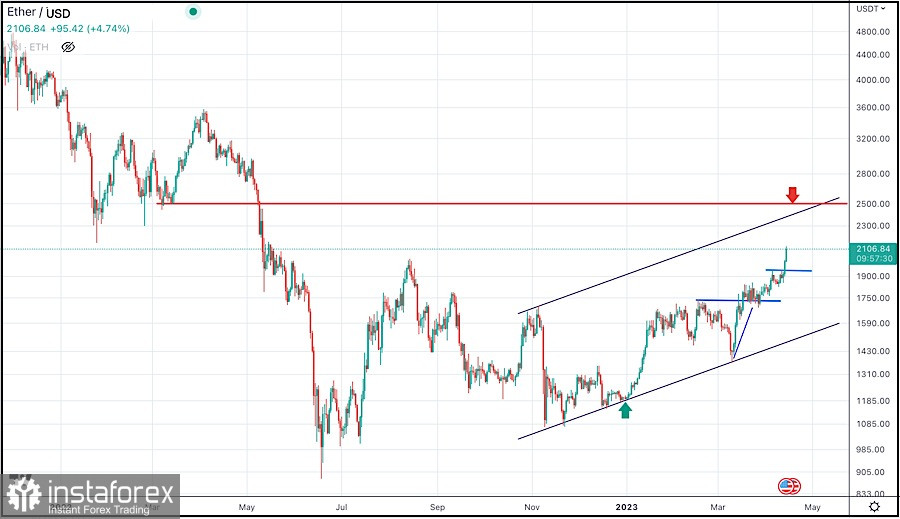
Ethereum has been one of the best-performing cryptocurrencies in the market, with significant gains since the beginning of the year. The recent technical analysis of the Ethereum/USD chart shows a potential bullish trend in the near future.
The updated technical analysis of the Ethereum/USD chart indicates that Ethereum has broken out of a key resistance level against USD, which could lead to further gains.
The cryptocurrency is trading within an ascending channel on the USD chart, signaling a potential bullish move.
Ethereum is trading above its 50-day moving average, indicating a bullish trend. However, the Relative Strength Index (RSI) is approaching overbought levels, which indicates a potential correction.
Hence, Ethereum may experience a pullback before continuing its upward trend against USD.
Traders should keep an eye on the price action around the 2500$ level, as it is a key resistance level. A break above this level could lead to further gains towards the 3000$ level. Conversely, a break below the 2000 $ support level could lead to a short-term bearish trend.
In summary, Ethereum against USD chart points to further continuation of the ongoing bullish trend, with a key resistance level at 2500.
Traders should be cautious and wait for confirmation of the bullish trend before entering any long positions.
You have already liked this post today
* Analisis pasaran yang disiarkan di sini adalah bertujuan untuk meningkatkan kesedaran anda, tetapi tidak untuk memberi arahan untuk membuat perdagangan.
XAU/USD, Jumaat, 11 Julai 2025. Walaupun harga emas kelihatan mengalami sedikit pembetulan selepas tertahan di tahap rintangan pertama (R1), kombinasi faktor teknikal dan fundamental masih menyokong potensi pengukuhan XAU/USD pada
Pada hari Rabu, pasangan EUR/USD terus bergerak mengikut trajektori yang hanya diketahui oleh dirinya sendiri. Tahap pembetulan Fibonacci 127.2% pada 1.1712 sekali lagi diabaikan oleh pedagang. Saya masih tidak mengesyorkan
Pada carta setiap jam, pasangan GBP/USD meneruskan pergerakan menaiknya pada hari Rabu selepas melantun dari paras pembetulan Fibonacci 127.2% di 1.3527. Lantunan tersebut berlaku dengan ketepatan tinggi, membawa kepada pembalikan
Pada hari Khamis, pasangan GBP/JPY sedang mendapatkan semula momentum kenaikan dan menunjukkan kesediaan untuk pertumbuhan lebih lanjut. Pembentukan saluran menaik mengesahkan kestabilan aliran kenaikan. Semasa sesi Asia, pembeli menjadi lebih
USD/CHF, Khamis, 10 Julai 2025 Selain khabar angin mengenai rancangan pemotongan kadar faedah oleh Rizab Persekutuan serta kejatuhan hasil bon kerajaan AS, pasangan USD/CHF melemah pada hari ini. Paras Utama
GBP/USD, Khamis, 10 Julai 2025. Pasangan GBP/USD berpotensi mengukuh semula hari ini, didorong oleh spekulasi pasaran mengenai kemungkinan pendekatan dovish oleh Rizab Persekutuan AS dalam masa terdekat. Khabar angin
InstaTrade
Akaun PAMM
Your IP address shows that you are currently located in the USA. If you are a resident of the United States, you are prohibited from using the services of InstaFintech Group including online trading, online transfers, deposit/withdrawal of funds, etc.
If you think you are seeing this message by mistake and your location is not the US, kindly proceed to the website. Otherwise, you must leave the website in order to comply with government restrictions.
Why does your IP address show your location as the USA?
Please confirm whether you are a US resident or not by clicking the relevant button below. If you choose the wrong option, being a US resident, you will not be able to open an account with InstaTrade anyway.
We are sorry for any inconvenience caused by this message.