Двойная вершина
сформирован 13.06 в 02:00:25 (UTC+0)
сила сигнала 3 из 5

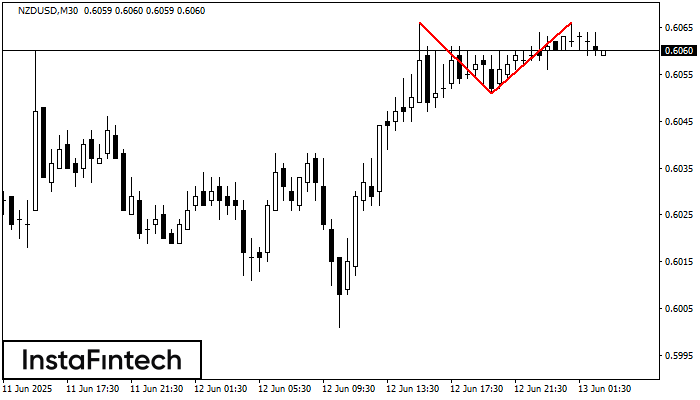
По NZDUSD на M30 сформировалась разворотная фигура «Двойная вершина». Характеристика: Верхняя граница 0.6066; Нижняя граница 0.6051; Ширина фигуры 15 пунктов. Позицию на продажу возможно открыть ниже нижней границы 0.6051, с перспективой хода к уровню 0.6021.
Сондай-ақ қараңыз
- Все
- Все
- Bearish Rectangle
- Bearish Symmetrical Triangle
- Bullish Rectangle
- Double Top
- Double Top
- Triple Bottom
- Triple Bottom
- Triple Top
- Triple Top
- Все
- Все
- Покупка
- Продажа
- Все
- 1
- 2
- 3
- 4
- 5
Bullish Symmetrical Triangle
сформирован 20.08 в 18:17:53 (UTC+0)
сила сигнала 1 из 5
According to the chart of M5, AUDUSD formed the Bullish Symmetrical Triangle pattern. Description: This is the pattern of a trend continuation. 0.6449 and 0.6417 are the coordinates
The M5 and M15 time frames may have more false entry points.
Открыть график инструмента в новом окне
Bullish Symmetrical Triangle
сформирован 20.08 в 18:06:24 (UTC+0)
сила сигнала 1 из 5
According to the chart of M5, NZDCAD formed the Bullish Symmetrical Triangle pattern. The lower border of the pattern touches the coordinates 0.8061/0.8076 whereas the upper border goes across 0.8088/0.8076
The M5 and M15 time frames may have more false entry points.
Открыть график инструмента в новом окне
Bullish Symmetrical Triangle
сформирован 20.08 в 18:05:51 (UTC+0)
сила сигнала 1 из 5
According to the chart of M5, AUDCAD formed the Bullish Symmetrical Triangle pattern. The lower border of the pattern touches the coordinates 0.8898/0.8917 whereas the upper border goes across 0.8931/0.8917
The M5 and M15 time frames may have more false entry points.
Открыть график инструмента в новом окне