Голова и плечи
сформирован 06.06 в 05:01:27 (UTC+0)
сила сигнала 4 из 5

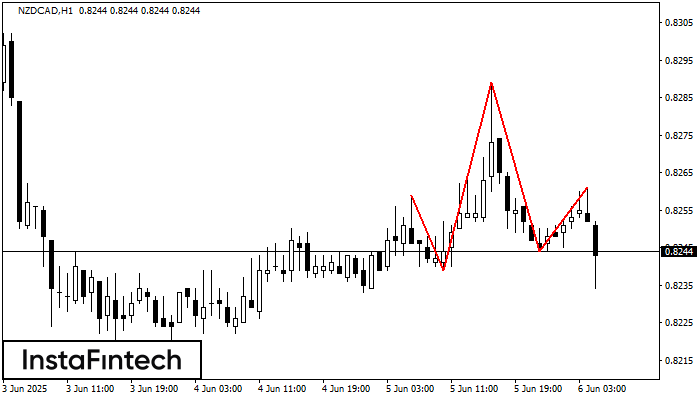
Графическая фигура «Голова и плечи» сформировалась по инструменту NZDCAD на H1. Вероятно предполагать, что после формирования правого плеча цена преодолеет уровень шеи 0.8239/0.8244, изменяя тем самым тенденцию и фактически направляя нас к значению 0.8204.
Сондай-ақ қараңыз
- Все
- Все
- Bearish Rectangle
- Bearish Symmetrical Triangle
- Bullish Rectangle
- Double Top
- Double Top
- Triple Bottom
- Triple Bottom
- Triple Top
- Triple Top
- Все
- Все
- Покупка
- Продажа
- Все
- 1
- 2
- 3
- 4
- 5
Double Top
сформирован 11.08 в 23:15:46 (UTC+0)
сила сигнала 2 из 5
The Double Top pattern has been formed on NZDCHF M15. It signals that the trend has been changed from upwards to downwards. Probably, if the base of the pattern 0.4816
The M5 and M15 time frames may have more false entry points.
Открыть график инструмента в новом окне
Triple Top
сформирован 11.08 в 23:00:21 (UTC+0)
сила сигнала 1 из 5
The Triple Top pattern has formed on the chart of the NZDJPY M5. Features of the pattern: borders have an ascending angle; the lower line of the pattern
The M5 and M15 time frames may have more false entry points.
Открыть график инструмента в новом окне
Bullish Symmetrical Triangle
сформирован 11.08 в 21:40:16 (UTC+0)
сила сигнала 1 из 5
According to the chart of M5, AUDCAD formed the Bullish Symmetrical Triangle pattern. The lower border of the pattern touches the coordinates 0.8965/0.8970 whereas the upper border goes across 0.8977/0.8970
The M5 and M15 time frames may have more false entry points.
Открыть график инструмента в новом окне