Двойная вершина
сформирован 05.06 в 16:40:32 (UTC+0)
сила сигнала 1 из 5

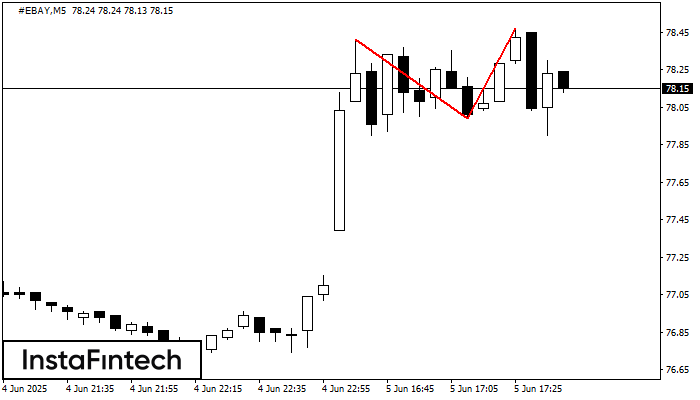
По торговому инструменту #EBAY на M5 сформировалась фигура «Двойная вершина», которая сигнализирует нам об изменении тенденции с восходящей на нисходящую. Вероятно, что, в случае пробоя основания фигуры 77.99, возможно дальнейшее нисходящее движение.
Таймфреймы М5 и М15 могут иметь больше ложных точек входа.
Сондай-ақ қараңыз
- Все
- Все
- Bearish Rectangle
- Bearish Symmetrical Triangle
- Bullish Rectangle
- Double Top
- Double Top
- Triple Bottom
- Triple Bottom
- Triple Top
- Triple Top
- Все
- Все
- Покупка
- Продажа
- Все
- 1
- 2
- 3
- 4
- 5
Double Top
сформирован 13.08 в 10:30:11 (UTC+0)
сила сигнала 3 из 5
The Double Top pattern has been formed on AUDJPY M30. It signals that the trend has been changed from upwards to downwards. Probably, if the base of the pattern 96.50
Открыть график инструмента в новом окне
Head and Shoulders
сформирован 13.08 в 10:20:15 (UTC+0)
сила сигнала 1 из 5
The technical pattern called Head and Shoulders has appeared on the chart of AUDJPY M5. There are weighty reasons to suggest that the price will surpass the Neckline 96.50/96.53 after
The M5 and M15 time frames may have more false entry points.
Открыть график инструмента в новом окне
Bullish Rectangle
сформирован 13.08 в 07:48:16 (UTC+0)
сила сигнала 1 из 5
According to the chart of M5, AUDJPY formed the Bullish Rectangle. The pattern indicates a trend continuation. The upper border is 96.67, the lower border is 96.53. The signal means
The M5 and M15 time frames may have more false entry points.
Открыть график инструмента в новом окне