Двойное дно
сформирован 05.06 в 15:00:20 (UTC+0)
сила сигнала 4 из 5

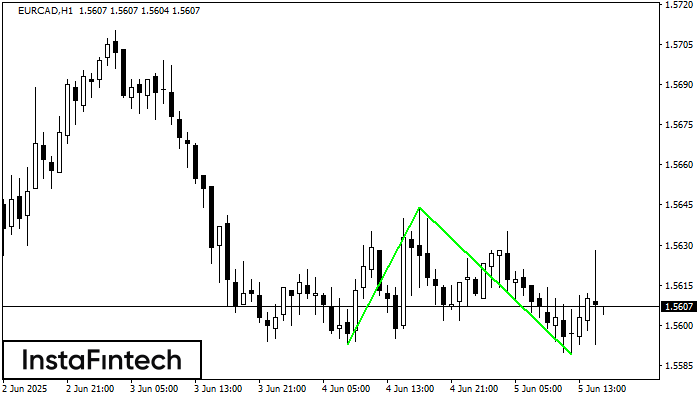
Сформирована фигура «Двойное дно» на графике EURCAD H1. Верхняя граница 1.5644; Нижняя граница 1.5589; Ширина фигуры 51 пунктов. В случае пробоя верхней границы 1.5644 можно будет прогнозировать изменение тенденции, где ширина фигуры и будет являться расстоянием предположительного Тейк Профита.
Сондай-ақ қараңыз
- Все
- Все
- Bearish Rectangle
- Bearish Symmetrical Triangle
- Bullish Rectangle
- Double Top
- Double Top
- Triple Bottom
- Triple Bottom
- Triple Top
- Triple Top
- Все
- Все
- Покупка
- Продажа
- Все
- 1
- 2
- 3
- 4
- 5
Double Top
сформирован 15.07 в 21:55:23 (UTC+0)
сила сигнала 1 из 5
On the chart of #PEP M5 the Double Top reversal pattern has been formed. Characteristics: the upper boundary 134.38; the lower boundary 133.94; the width of the pattern 44 points
The M5 and M15 time frames may have more false entry points.
Открыть график инструмента в новом окне
Double Top
сформирован 15.07 в 21:55:15 (UTC+0)
сила сигнала 1 из 5
The Double Top pattern has been formed on #PEP M5. It signals that the trend has been changed from upwards to downwards. Probably, if the base of the pattern 133.94
The M5 and M15 time frames may have more false entry points.
Открыть график инструмента в новом окне
Triple Bottom
сформирован 15.07 в 20:15:29 (UTC+0)
сила сигнала 1 из 5
The Triple Bottom pattern has formed on the chart of #TSLA M5. Features of the pattern: The lower line of the pattern has coordinates 315.22 with the upper limit 315.22/314.84
The M5 and M15 time frames may have more false entry points.
Открыть график инструмента в новом окне