Прямоугольник
сформирован 29.05 в 19:18:23 (UTC+0)
сила сигнала 3 из 5

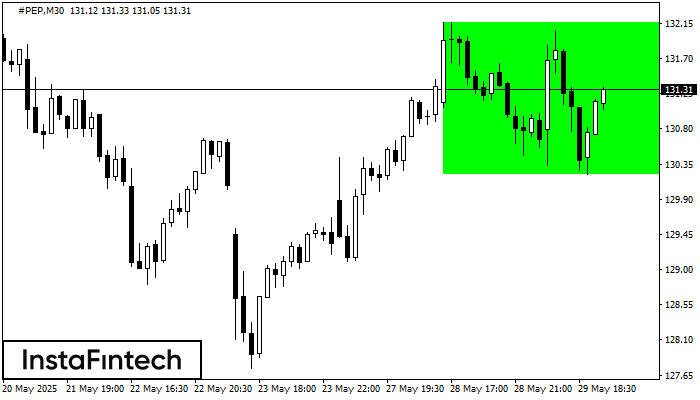
Сформирована фигура «Прямоугольник» на графике #PEP M30. Тип фигуры: Продолжение тренда; Границы: Верхняя 132.16, Нижняя 130.22; Сигнал: позицию на покупку следует открывать выше верхней границы прямоугольника 132.16.
Сондай-ақ қараңыз
- Все
- Все
- Bearish Rectangle
- Bearish Symmetrical Triangle
- Bullish Rectangle
- Double Top
- Double Top
- Triple Bottom
- Triple Bottom
- Triple Top
- Triple Top
- Все
- Все
- Покупка
- Продажа
- Все
- 1
- 2
- 3
- 4
- 5
Bearish Rectangle
сформирован 15.07 в 18:21:50 (UTC+0)
сила сигнала 1 из 5
According to the chart of M5, #PEP formed the Bearish Rectangle which is a pattern of a trend continuation. The pattern is contained within the following borders: lower border 133.77
The M5 and M15 time frames may have more false entry points.
Открыть график инструмента в новом окне
Bearish Rectangle
сформирован 15.07 в 18:21:40 (UTC+0)
сила сигнала 1 из 5
According to the chart of M5, #PEP formed the Bearish Rectangle which is a pattern of a trend continuation. The pattern is contained within the following borders: lower border 133.77
The M5 and M15 time frames may have more false entry points.
Открыть график инструмента в новом окне
Double Bottom
сформирован 15.07 в 17:30:24 (UTC+0)
сила сигнала 1 из 5
The Double Bottom pattern has been formed on #TSLA M5; the upper boundary is 320.87; the lower boundary is 312.48. The width of the pattern is 824 points. In case
The M5 and M15 time frames may have more false entry points.
Открыть график инструмента в новом окне