Двойное дно
сформирован 19.05 в 15:59:40 (UTC+0)
сила сигнала 3 из 5

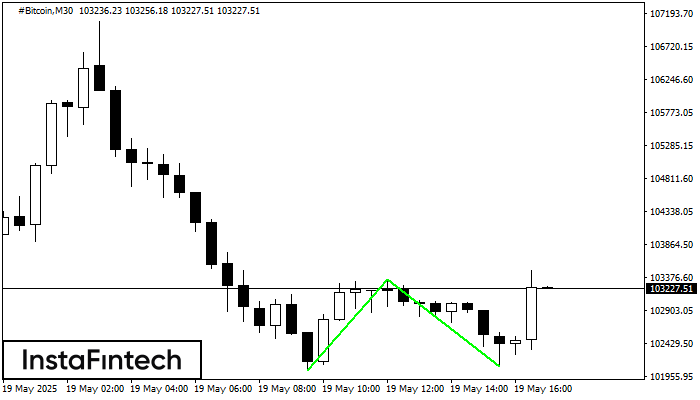
Сформирована фигура «Двойное дно» на графике #Bitcoin M30. Верхняя граница 103355.86; Нижняя граница 102090.12; Ширина фигуры 131679 пунктов. В случае пробоя верхней границы 103355.86 можно будет прогнозировать изменение тенденции, где ширина фигуры и будет являться расстоянием предположительного Тейк Профита.
- Все
- Все
- Bearish Rectangle
- Bearish Symmetrical Triangle
- Bullish Rectangle
- Double Top
- Double Top
- Triple Bottom
- Triple Bottom
- Triple Top
- Triple Top
- Все
- Все
- Покупка
- Продажа
- Все
- 1
- 2
- 3
- 4
- 5
Bearish Rectangle
сформирован 24.06 в 15:09:05 (UTC+0)
сила сигнала 2 из 5
According to the chart of M15, EURGBP formed the Bearish Rectangle. The pattern indicates a trend continuation. The upper border is 0.8533, the lower border is 0.8519. The signal means
The M5 and M15 time frames may have more false entry points.
Открыть график инструмента в новом окне
Bearish Rectangle
сформирован 24.06 в 15:00:24 (UTC+0)
сила сигнала 1 из 5
According to the chart of M5, EURGBP formed the Bearish Rectangle. The pattern indicates a trend continuation. The upper border is 0.8533, the lower border is 0.8519. The signal means
The M5 and M15 time frames may have more false entry points.
Открыть график инструмента в новом окне
Double Bottom
сформирован 24.06 в 14:59:59 (UTC+0)
сила сигнала 3 из 5
The Double Bottom pattern has been formed on EURNZD M30. This formation signals a reversal of the trend from downwards to upwards. The signal is that a buy trade should
Открыть график инструмента в новом окне