Двойное дно
сформирован 15.05 в 08:30:09 (UTC+0)
сила сигнала 3 из 5

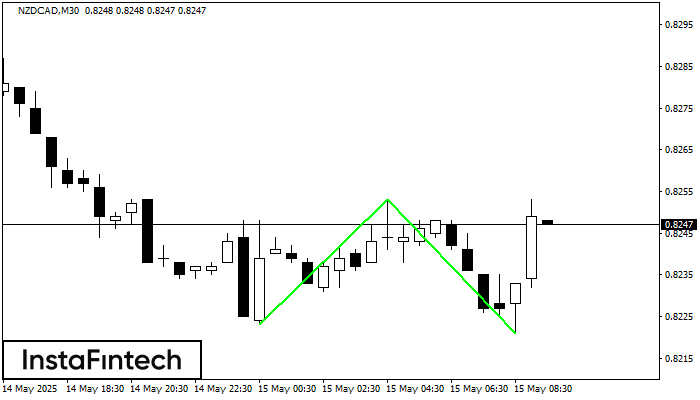
Сформирована фигура «Двойное дно» на графике NZDCAD M30. Характеристика: Уровень поддержки 0.8223; Уровень сопротивления 0.8253; Ширина фигуры 30 пунктов. В случае пробоя уровня сопротивления можно будет прогнозировать изменение тенденции, где первая точка фиксации прибыли находится на расстоянии 32 пунктов.
- Все
- Все
- Bearish Rectangle
- Bearish Symmetrical Triangle
- Bullish Rectangle
- Double Top
- Double Top
- Triple Bottom
- Triple Bottom
- Triple Top
- Triple Top
- Все
- Все
- Покупка
- Продажа
- Все
- 1
- 2
- 3
- 4
- 5
Double Bottom
сформирован 21.06 в 20:40:40 (UTC+0)
сила сигнала 1 из 5
The Double Bottom pattern has been formed on #Bitcoin M5; the upper boundary is 103384.03; the lower boundary is 103150.22. The width of the pattern is 24856 points. In case
The M5 and M15 time frames may have more false entry points.
Открыть график инструмента в новом окне
Bullish Symmetrical Triangle
сформирован 21.06 в 15:17:59 (UTC+0)
сила сигнала 1 из 5
According to the chart of M5, #Bitcoin formed the Bullish Symmetrical Triangle pattern. The lower border of the pattern touches the coordinates 103655.19/103820.77 whereas the upper border goes across 103940.04/103820.77
The M5 and M15 time frames may have more false entry points.
Открыть график инструмента в новом окне
Triple Bottom
сформирован 20.06 в 22:20:23 (UTC+0)
сила сигнала 1 из 5
The Triple Bottom pattern has been formed on GOLD M5. It has the following characteristics: resistance level 3372.86/3370.25; support level 3364.73/3364.26; the width is 813 points. In the event
The M5 and M15 time frames may have more false entry points.
Открыть график инструмента в новом окне