वास्तविक पैटर्न

पैटर्न ग्राफिकल मॉडल हैं जो चार्ट में मूल्य से बने होते हैं। तकनीकी विश्लेषण भविष्यवाणियों में से एक के अनुसार, इतिहास का मतलब मूल्य आंदोलन खुद को दोहराता है। इसका मतलब है कि मूल्य आंदोलन अक्सर एक ही परिस्थितियों में समान होते हैं जो उच्च संभावना के साथ स्थिति के आगे के विकास की भविष्यवाणी करना संभव बनाता है।
इंस्टा फॉरेक्स द्वारा प्रासंगिक पैटर्न एक उपयोग में आसान सेवा है जो आपको बाजार में नवीनतम परिवर्तनों के बारे में जागरूक होने और समय पर बाजार से संकेतों पर प्रतिक्रिया करने की अनुमति देती है। हमारी सेवा में आप हमेशा किसी भी जोड़ी और किसी भी समय सीमा पर नवीनतम और सबसे प्रासंगिक पैटर्न प्राप्त कर सकते हैं.
Head and Shoulders
was formed on 03.06 at 10:30:19 (UTC+0)
signal strength 3 of 5
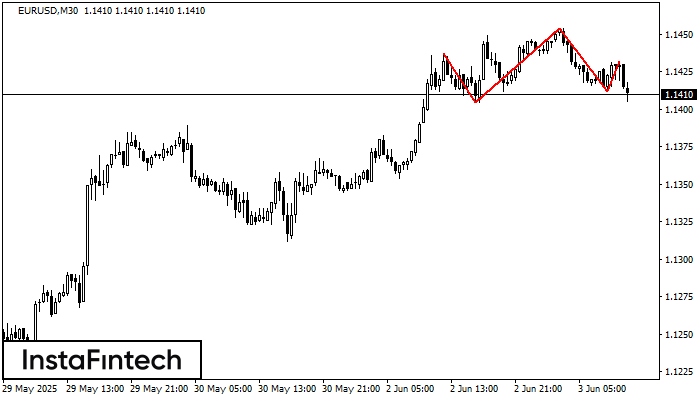
The technical pattern called Head and Shoulders has appeared on the chart of EURUSD M30. There are weighty reasons to suggest that the price will surpass the Neckline 1.1404/1.1412 after the right shoulder has been formed. So, the trend is set to change with the price heading for 1.1382.
See Also
- All
- All
- Bearish Rectangle
- Bearish Symmetrical Triangle
- Bearish Symmetrical Triangle
- Bullish Rectangle
- Double Top
- Double Top
- Triple Bottom
- Triple Bottom
- Triple Top
- Triple Top
- All
- All
- Buy
- Sale
- All
- 1
- 2
- 3
- 4
- 5
बुलिश आयत
was formed on 11.08 at 04:01:16 (UTC+0)
signal strength 3 of 5
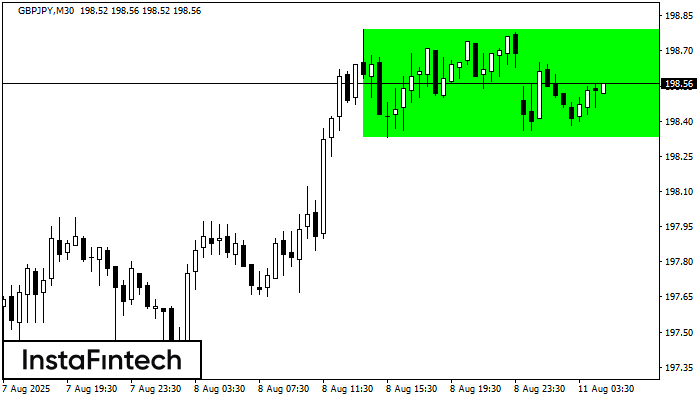
M30 के चार्ट के अनुसार, GBPJPY से बुलिश आयत बना। पैटर्न एक प्रवृत्ति निरंतरता को इंगित करता है। ऊपरी सीमा 198.79 है, निचली सीमा 198.33 है। सिग्नल का मतलब है
Open chart in a new window
डबल बॉटम
was formed on 11.08 at 03:00:24 (UTC+0)
signal strength 1 of 5
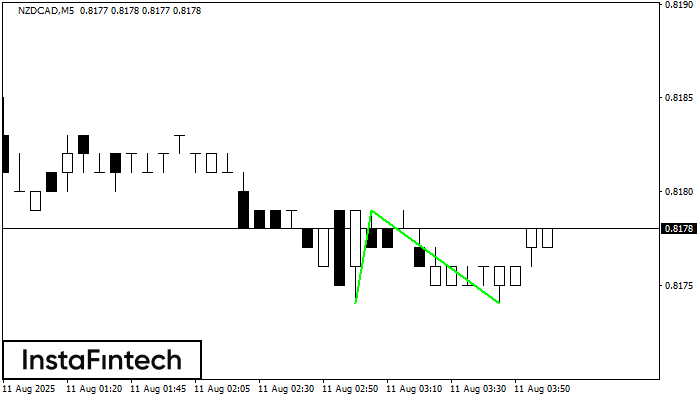
डबल बॉटम पैटर्न NZDCAD M5 पर बना है। यह फॉर्मेशन नीचे से ऊपर की ओर प्रवृत्ति के उलट होने का संकेत देता है। संकेत यह है कि पैटर्न 0.8179 की
M5 और M15 समय सीमा में अधिक फाल्स एंट्री पॉइंट्स हो सकते हैं।
Open chart in a new window
डबल टॉप
was formed on 11.08 at 00:00:17 (UTC+0)
signal strength 4 of 5
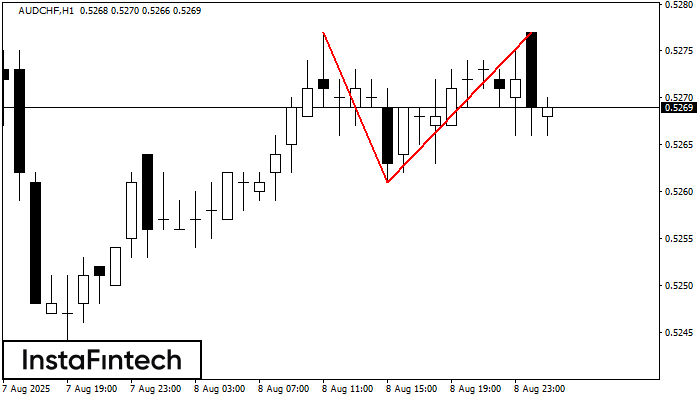
AUDCHF H1 पर डबल टॉप रीवर्सल पैटर्न बना है। विशेषताएं: ऊपरी सीमा 0.5277; निचली सीमा 0.5261; पैटर्न की चौड़ाई 16 पॉइंट्स है। सेल ट्रेडों को 0.5261 की निचली सीमा के
Open chart in a new window