यह भी देखें

 04.03.2026 04:42 AM
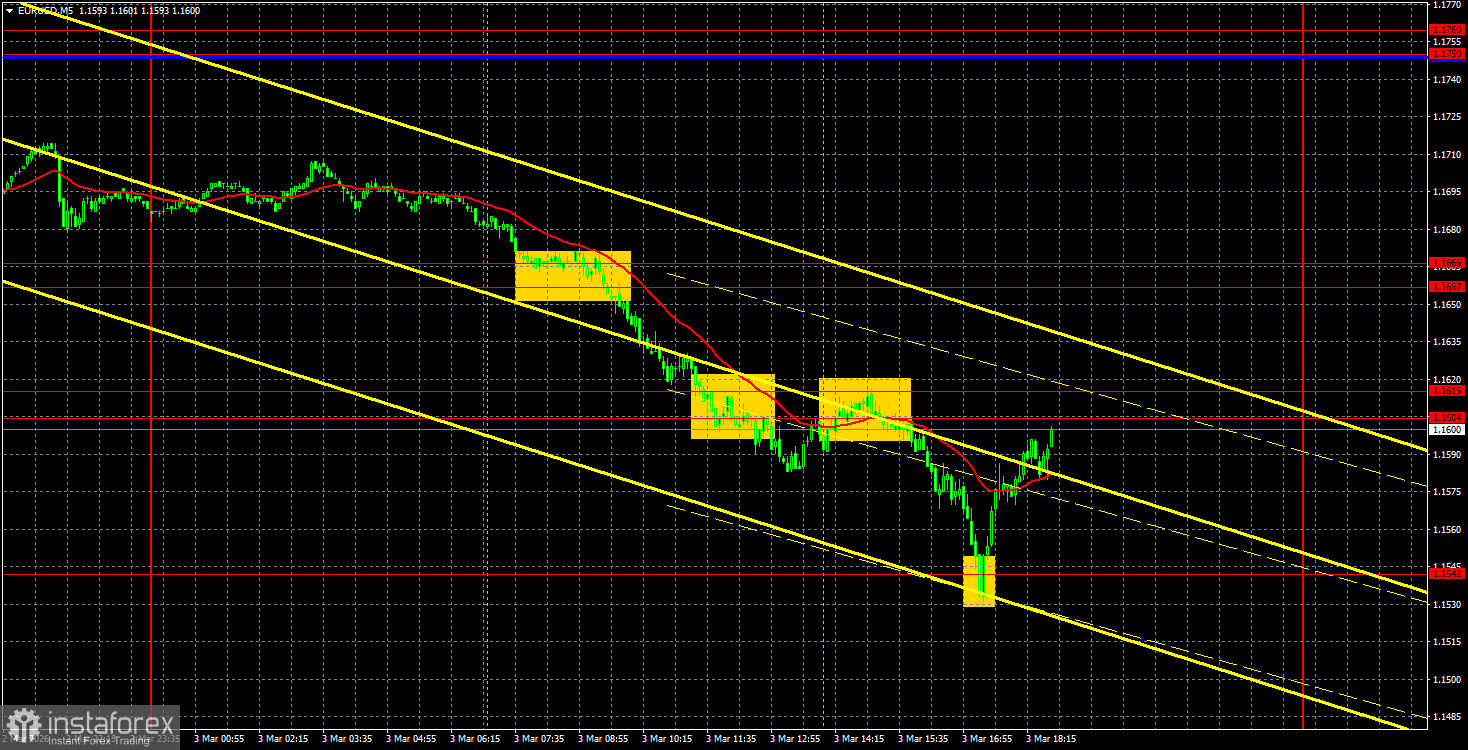
The EUR/USD currency pair has continued its sharp decline, but now the US dollar's new powerful growth is working against it. Recall that the only reason for the rise of the American currency this week and in recent weeks has been geopolitics. Namely, the full-scale war in the Middle East involving at least 10 countries. Additionally, there are reports that Iran has launched missile strikes on American bases located in Turkey and Cyprus. Thus, the geography of the conflict is expanding rapidly. The energy markets are soaring, the cryptocurrency market is stagnant, and the currency market is plunging (with the dollar rising). However, we still do not believe that the dollar will continue its victorious march.
Now, of course, the pair will need time to recover from the blow and return to the year's highs. But again: what reasons are there for the dollar to rise, apart from geopolitical factors? The conflict in Iran involving the US has obviously been brewing in recent weeks, but how long will the market continue to buy dollars based solely on this factor? Recall that this week, US labor and unemployment data will be released, and macroeconomic data from across the ocean remain quite contradictory. Donald Trump's policies have not changed, the trade war continues, and by the end of the year, the US president could well face impeachment. In our view, there are no compelling reasons for the dollar to rise.
On the 5-minute timeframe, four excellent signals were formed on Tuesday. First, the pair consolidated below the 1.1657-1.1666 area, then broke through the 1.1604-1.1615 area, and subsequently bounced off the 1.1542 level. Thus, traders could initially open short positions, which yielded at least 80-90 pips in profit, and then open long positions, which also closed profitably as the nearest target was reached.
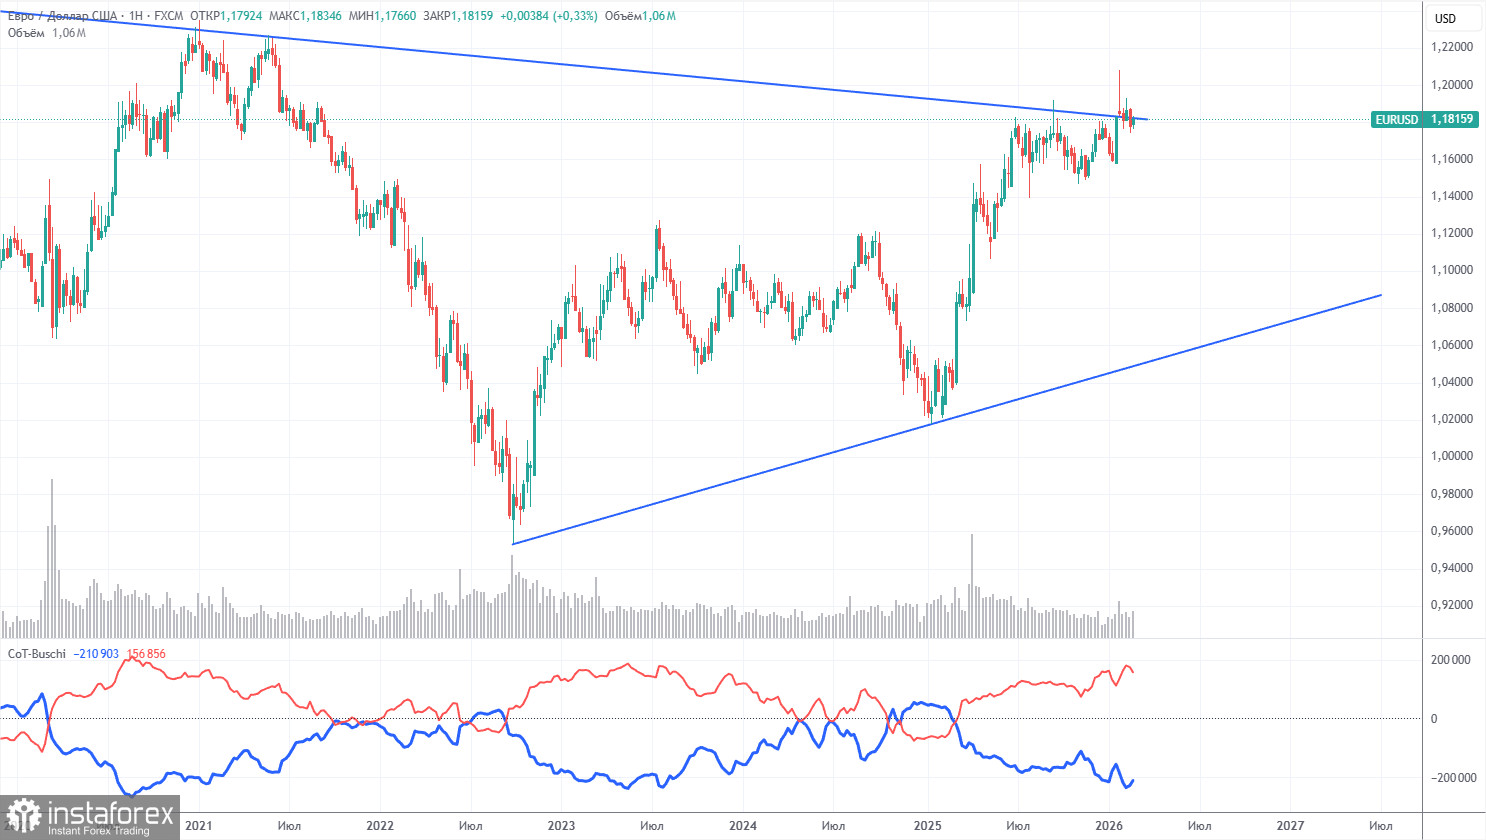
The latest COT report is dated February 24. The weekly timeframe illustration clearly shows that the net position of non-commercial traders remains "bullish," and since Trump took office as US President for the second time, the dollar has only been falling. We cannot say that the decline of the American currency will continue with 100% probability, but current developments around the world suggest this is a possibility.
We still do not see any fundamental factors that would strengthen the European currency, while there remain sufficient factors for the decline of the American one. The global downward trend is still in place, but what significance does it have now regarding where the price has moved over the last 18 years? A new upward trend has formed since September 2022, breaking the global downward trend line. Thus, the path further north is open.
The indicator's red and blue lines still indicate a "bullish" trend. During the last reporting week, the number of longs for the "Non-commercial" group decreased by 16,700, while the number of shorts increased by 900. Consequently, the net position decreased by 15,800 contracts over the week.
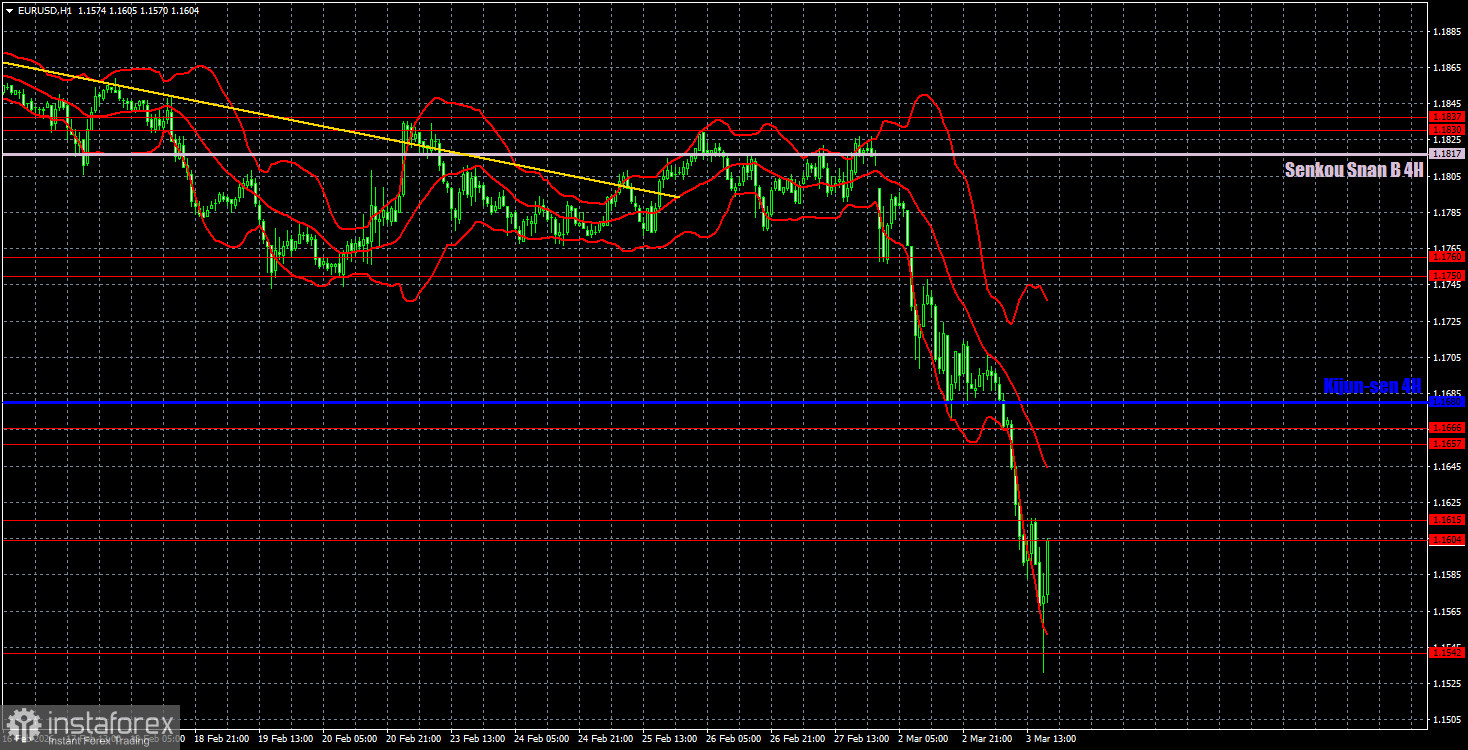
On the hourly timeframe, the EUR/USD pair continues a strong downward movement amid geopolitical events in the Middle East. It remains unclear how long the dollar's rise driven by this single factor will persist, as it will depend on the intensity and duration of the war, losses on both sides, and the US's ability to achieve its set objectives. However, we are once again seeing a downward trend.
For March 4, we identify the following trading levels: 1.1362, 1.1426, 1.1542, 1.1604-1.1615, 1.1657-1.1666, 1.1750-1.1760, 1.1830-1.1837, 1.1907-1.1922, 1.1971-1.1988, as well as the Senkou Span B line (1.1817) and Kijun-sen (1.1680). The Ichimoku indicator lines may shift during the day, which should be taken into account when determining trading signals. We do not forget to set a stop-loss order at break-even if the price moves in the correct direction by 15 pips. This will protect against potential losses if the signal turns out to be false.
On Wednesday, only secondary reports are scheduled in the European Union, such as the second estimates of business activity indices in the service sectors for February or the unemployment rate. In the US, a significant ISM report for the services sector and a less significant ADP report for the US labor market will be released. Today will show whether the market will continue to react solely to the geopolitical factor.
On Wednesday, traders may consider selling with targets of 1.1542 and 1.1426 if there is a bounce from the area of 1.1604-1.1615. Long positions can be considered with targets of 1.1657-1.1666 if the area of 1.1604-1.1615 is broken through.
Price levels of support and resistance are indicated by thick red lines, around which movement may end. They are not sources of trading signals.
The Kijun-sen and Senkou Span B lines are lines from the Ichimoku indicator that are transferred from the four-hour timeframe to the hourly one. They are considered strong lines.
Extremum levels are indicated by thin red lines from which the price previously bounced. They are sources of trading signals.
Yellow lines indicate trend lines, trend channels, and any other technical patterns.
Indicator 1 on the COT charts shows the size of each category of traders' net position.

