আরও দেখুন

 16.06.2026 05:25 AM
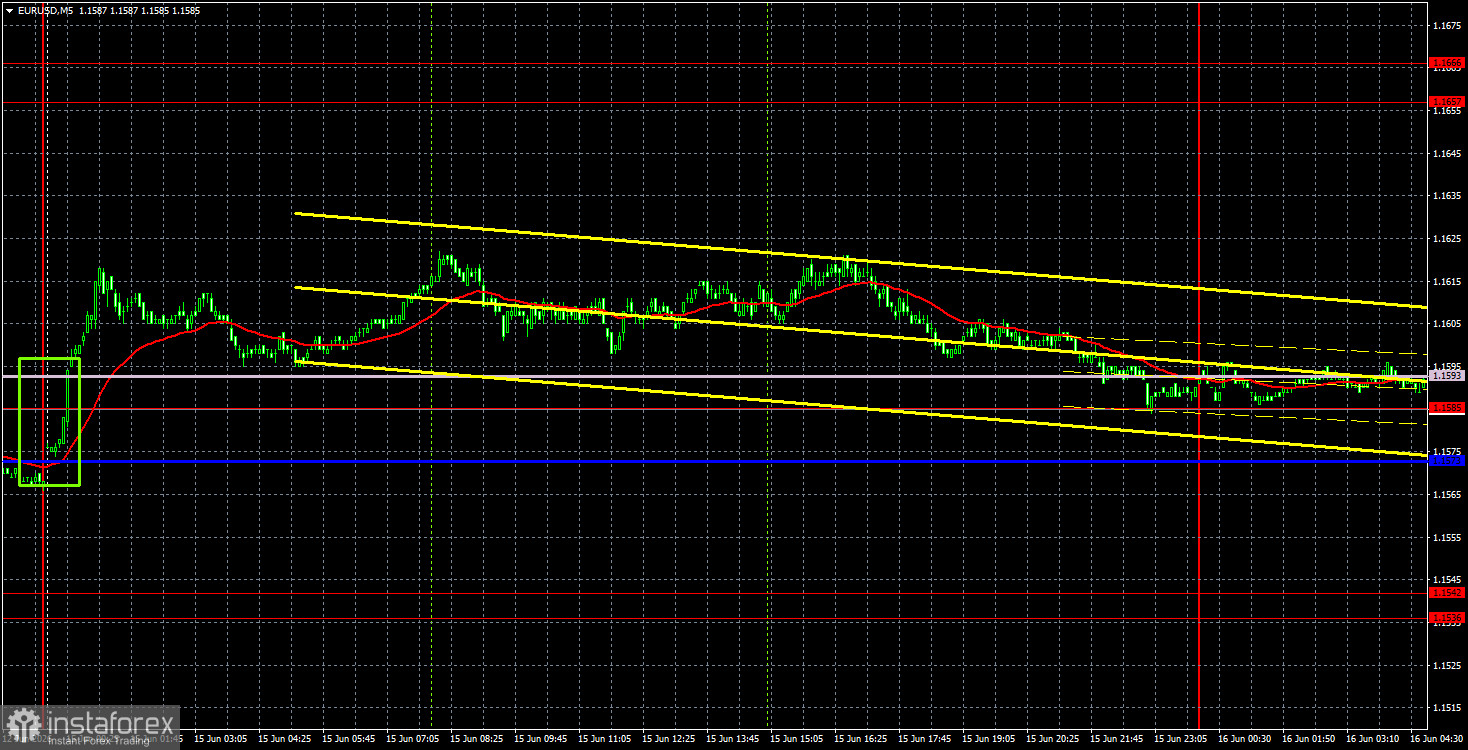
The EUR/USD currency pair started Monday on a strong note, but ended quietly. In the first hour of the new week, the European currency soared by about 40 pips, but then traded with low volatility, mostly sideways, for the rest of the day. It became known yesterday that an agreement between Iran and the US has been reached, but its ratification is scheduled for Friday in Geneva. Therefore, it is still too early to speak about the end of the war and the opening of the Strait of Hormuz. Traders have been burnt so many times in recent months that they are now cautious about even minor developments. For this reason, we did not see a strong decline in the US dollar on Monday. The market still doubts that the deal will be signed. And if it is, there are concerns about whether it will be upheld in the following days. Furthermore, if it is upheld, there are doubts about the success of negotiations concerning the nuclear issue. For now, the situation with the memorandum of understanding looks like a temporary solution that will not become a long-term one.
From a technical perspective, the downward trend has been canceled as the price has crossed both lines of the Ichimoku indicator. If Tehran and Washington do indeed sign the deal this week, demand for the US currency will fall. However, at this moment, the parties have only agreed on the document, and anything can happen before Friday. Uncertainty remains, so the market is not rushing to sell the safe US dollar.
In the 5-minute timeframe on Monday, the price generated a buy signal by breaking through the 1.1573-1.1585 area. During the day, the pair failed to develop upward momentum and reach the nearest resistance area. The profit from the trade was minimal, but the position can be held as long as the price remains above the Senkou Span B line.
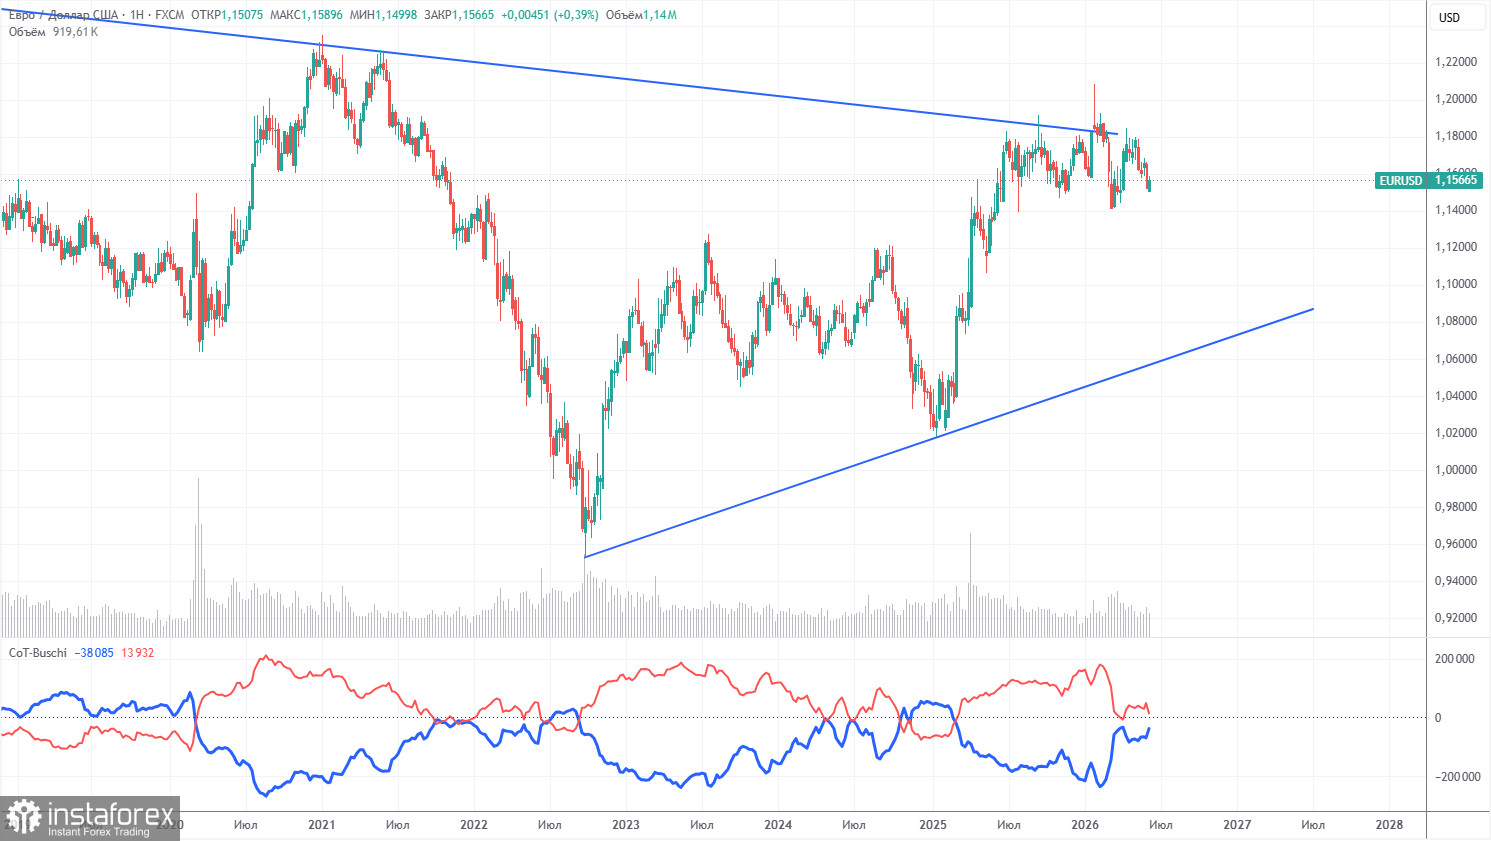
The latest COT report is dated June 9. The illustration on the weekly timeframe clearly shows that the net position of non-commercial traders remains "bullish," but has significantly decreased due to geopolitical events. Traders have been shedding the European currency in favor of the US dollar in recent months. Donald Trump's policies have not changed, but for some time, the dollar has served as a "reserve currency." However, this process may already be complete.
We still do not see any fundamental factors to strengthen the European currency, while there are enough factors to weaken the US dollar. The war in the Middle East made the dollar temporarily very attractive, but when this factor reaches its "expiration date," everything will revert to normal. And that expiration may have already occurred. In the long term, the euro could fall to as low as $1.08 (the trend line), but the upward trend will still remain relevant. Over the past few months, the pair has not moved significantly closer to this line.
The positioning of the red and blue lines of the indicator indicates parity between bulls and bears. During the last reporting week, the number of long positions in the "Non-commercial" group decreased by 15,900, while the number of shorts increased by 19,000. Consequently, the net position fell by 34,900 contracts over the week.
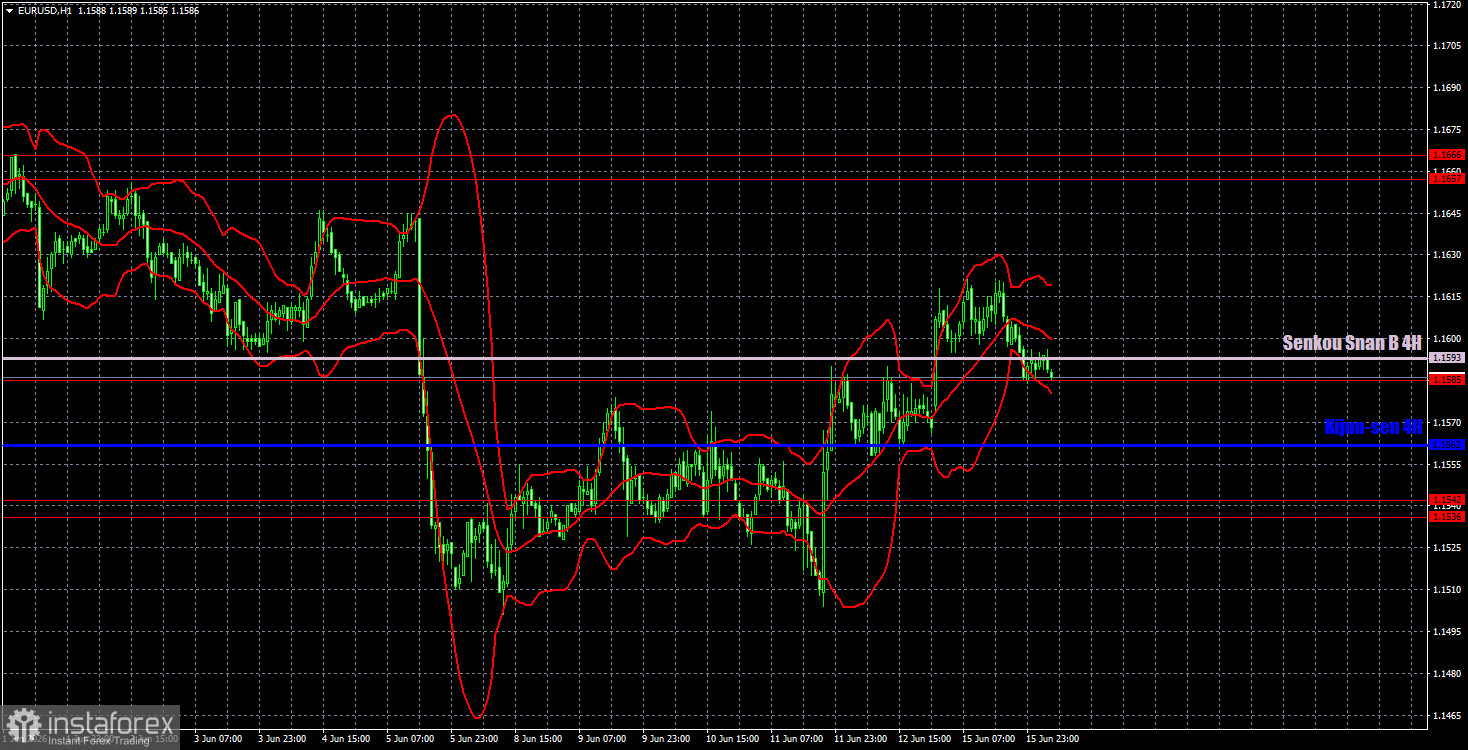
On the hourly timeframe, the EUR/USD pair has broken its downward trend after settling above the Senkou Span B line. The situation in the Middle East remains tense, but a full-scale war has not resumed. Thus, there are currently no reasons for the dollar to rise, and the market is not rushing to sell the dollar, as it still doubts the ability of Tehran and Washington to sign the agreement and then adhere to it.
For June 16, we identify the following trading levels: 1.1362, 1.1426, 1.1536-1.1542, 1.1585, 1.1657-1.1666, 1.1750-1.1760, 1.1786, 1.1830-1.1837, 1.1907-1.1922, as well as the Senkou Span B line (1.1562) and the Kijun-sen line (1.1593). The Ichimoku indicator lines may shift throughout the day, which should be considered when determining trading signals. Don't forget to set a stop-loss order to break even if the price moves in the right direction by 15 pips. This will protect against potential losses if the signal proves false.
On Tuesday, only secondary reports are scheduled to be released in the European Union and the US, and the market is unlikely to pay attention to them. On Monday, reports on industrial production in the EU and the US were ignored. Important events will occur throughout the week, and the market prefers to focus on them.
Today, traders may consider short positions targeting the 1.1536-1.1542 area if the price settles below the 1.1585-1.1593 area. Long positions can be opened on a bounce from the Senkou Span B line, with a target of 1.1657-1.1666.
Support and resistance price levels (resistance/support) – thick red lines around which movement may end. They are not sources of trading signals.
Kijun-sen and Senkou Span B lines – Ichimoku indicator lines transferred from the 4-hour timeframe to the hourly timeframe. They are strong lines.
Extreme levels – thin red lines from which the price previously rebounded. They are sources of trading signals.
Yellow lines – trend lines, trend channels, and any other technical patterns.
Indicator 1 on COT charts – the size of the net position of each category of traders.


