empty
03.04.2025 01:07 AM
#NDX – March Results and April Outlook

This image is no longer relevant

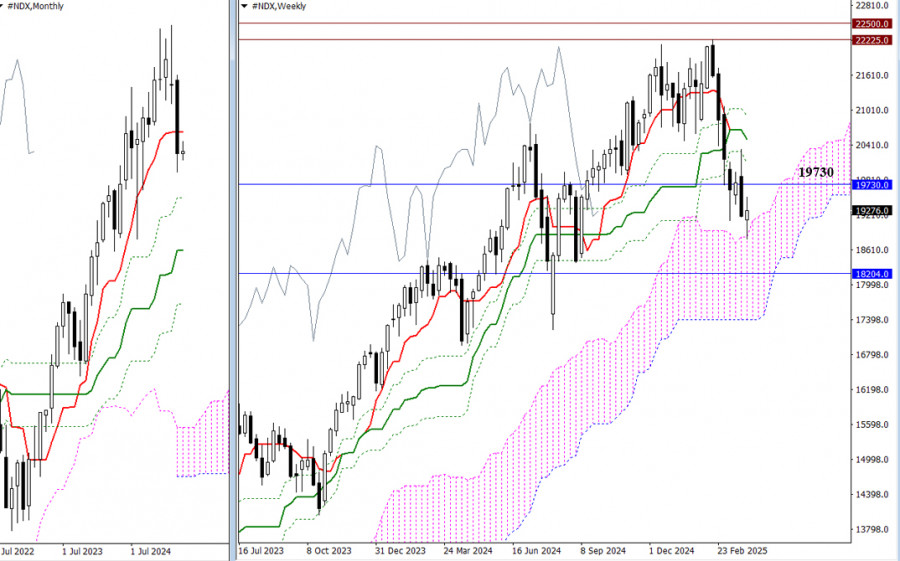
March concluded with a bearish candle that left a notable mark in the history books. Bears closed below the monthly short-term trend level (19,730) and eliminated the weekly golden cross, testing support at the upper boundary of the weekly Ichimoku cloud (18,821). If the decline continues, bearish targets will include testing and breaking through the next monthly support level (18,204) and exiting the weekly cloud (17,408). Should the bulls regain control by reclaiming the monthly short-term trend (19,730), they will aim to retest the levels of the weekly Ichimoku cross (20,103 – 20,508 – 20,914). Consolidation above these resistance levels will open the door for testing and updating the all-time high (22,225).

This image is no longer relevant

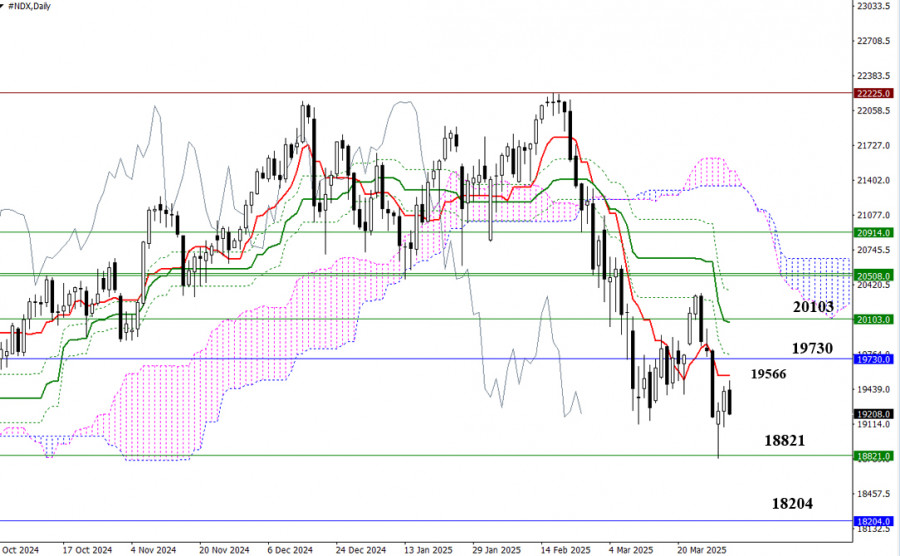
There is currently a downtrend occurring on the daily timeframe, but a corrective move has emerged and aims to test the first key level of the daily correction, which today lies at 19,566 (Tenkan-sen). Additional resistance levels are located at 19,730 – 19,765 – 20,065 – 20,103. A completed corrective climb followed by a drop below the corrective zone (18,792) will confirm a consolidation within the weekly cloud (18,821). The next downward target will be the monthly support at 18,204.

This image is no longer relevant

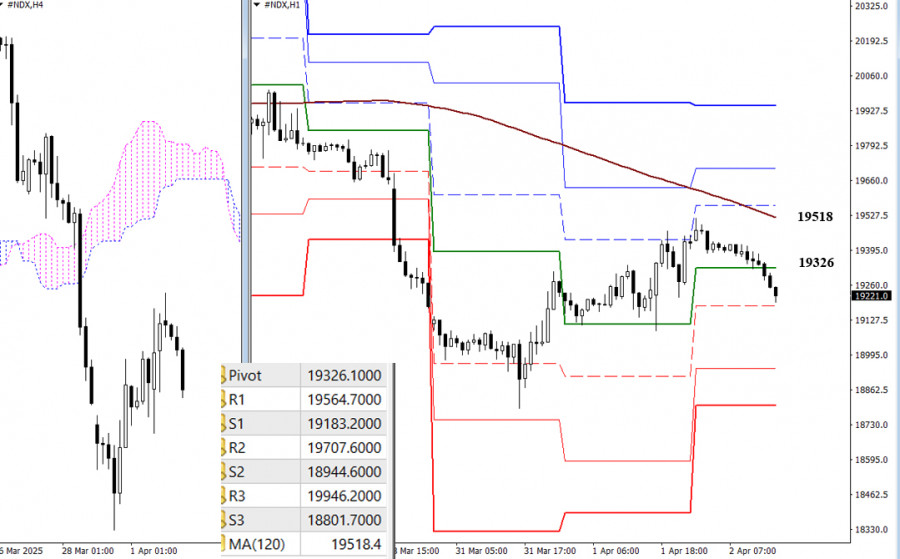
In the lower timeframes, the market is also in the corrective zone, and the main boundary on the way of bulls is the weekly long-term trend (19518). The breakdown and reversal of the trend will allow us to consider new upward benchmarks. The resistance of the classic Pivot levels (19565 - 19708 - 19946) will become these intraday targets. Completing the corrective rise and descent through the support of classic Pivot levels (19183 - 19945 - 18802) will allow an update on the minimum extreme of March (18792) and restore the downtrend.

***

Technical Analysis Components:
  • Higher Timeframes: Ichimoku Kinko Hyo (9.26.52) and Fibonacci Kijun levels
  • H1: Classic Pivot Points and 120-period Moving Average (weekly long-term trend)

Recommended Stories

EUR/USD পেয়ারের সূচক বিশ্লেষণ, ৭ আগস্ট, ২০২৫

বুধবারে, এই পেয়ারের মূল্য ঊর্ধ্বমুখী হয় এবং প্রায় 1.1672-এর 50% ফিবোনাচ্চি রিট্রেসমেন্ট লেভেলে (লাল ডটেড লাইন) পৌঁছেছিল, যার পর এই পেয়ারের মূল্য কিছুটা কমে যায় এবং দৈনিক ক্যান্ডেল 1.1658-এ থাকা

Stefan Doll 10:06 2025-08-07 UTC+2

GBP/USD পেয়ারের টেকনিক্যাল বিশ্লেষণ, আগস্ট ২০২৫

জুলাই মাসে এই পেয়ারের মূল্য নিম্নমুখী মুভমেন্ট প্রদর্শন করেছে এবং 8-পিরিয়ড EMA 1.3164 (হালকা নীল লাইন) প্রায় স্পর্শ করেছিল, এবং এই পেয়ারের মূল্য 1.3203-এ থাকা অবস্থায় মাসিক ক্যান্ডেলটি ক্লোজ হয়েছে।

Stefan Doll 12:23 2025-08-04 UTC+2

স্বর্ণের (XAU/USD) ট্রেডিং সিগন্যাল (৩১ জুলাই – ২ আগস্ট, ২০২৫): মূল্য $3,281-এর (21 SMA - 4/8 মারে) উপরে থাকা অবস্থায় ক্রয় করুন

ইউরোপীয় সেশনের শুরুতে স্বর্ণ 3,296 এর আশপাশে ট্রেড করা হচ্ছে, যেখানে এটির মূল্য 3,268 এর এরিয়ায় পৌঁছে শক্তিশালী টেকনিক্যাল রিবাউন্ড হওয়ার পর ঊর্ধ্বমুখী হয়েছে। এই 3,268 লেভেলটি একটি গুরুত্বপূর্ণ সাপোর্ট

Dimitrios Zappas 08:38 2025-07-31 UTC+2

বিটকয়েনের ট্রেডিং সিগন্যাল (৩১ জুলাই – ২ আগস্ট, ২০২৫): মূল্য $118,750-এর (6/8 মারে + 21 SMA) নিচে থাকা অবস্থায় বিটকয়েন বিক্রি করুন

যদি আগামী দিনগুলোতে বিটকয়েনের মূল্য $119,000 লেভেলের ওপরে কনসোলিডেট করে, তাহলে এটি একটি বুলিশ মুভমেন্টের সংকেত হতে পারে। আমাদের বিশ্বাস, তাহলে এটির মূল্য 7/8 মারে লেভেল 121,878 পর্যন্ত এবং এমনকি

Dimitrios Zappas 08:33 2025-07-31 UTC+2

স্বর্ণের (XAU/USD) ট্রেডিং সিগন্যাল (৩০–৩১ জুলাই, ২০২৫): স্বর্ণের মূল্য $3,320-এর (21 SMA - 5/8 মারে) উপরে অবস্থান করলে ক্রয় করার সুযোগ রয়েছে

স্বর্ণ বর্তমানে $3,332 এর আশেপাশে ট্রেড করছে, যেখানে এটির মূল্য $3,300-এর একটি গুরুত্বপূর্ণ লেভেল স্পর্শ করার পর পুনরুদ্ধার করতে শুরু করেছে। আগামী দিনগুলোতে স্বর্ণের মূল্য 7/8 মারে লেভেল অর্থাৎ $3,398-এর

Dimitrios Zappas 09:14 2025-07-30 UTC+2

বিটকয়েনের ট্রেডিং সিগন্যাল (৩০–৩১ জুলাই, ২০২৫): মূল্য $118,750-এর (6/8 মারে - 21 SMA) নিচে থাকা অবস্থায় বিক্রির সুযোগ রয়েছে

যদি আগামী কয়েক দিনে বিটকয়েনের মূলয় ডাউনট্রেন্ড চ্যানেলটি ব্রেক করে $119,000 লেভেলের উপরে কনসোলিডেট করতে পারে, তাহলে আমরা আশা করতে পারি যে বিটকয়েনের মূল্য $121,875 (7/8 মারে) পর্যন্ত পৌঁছাতে পারে

Dimitrios Zappas 09:09 2025-07-30 UTC+2

বিটকয়েনের ট্রেডিং সিগন্যাল (২৮–৩০ জুলাই, ২০২৫): মূল্য $119,800 (200 EMA - 21 SMA) এর নিচে থাকা অবস্থায় বিটকয়েন বিক্রি করুন

আগামী দিনগুলোতে এই রেঞ্জের মধ্যে বিটকয়েনের ট্রেড করা হতে পারে বলে ধারণা করা হচ্ছে, তাই আমরা মূল্য $121,000 এর নিচে থাকা অবস্থায় বিক্রি এবং $115,000 এর উপরে থাকা অবস্থায় ক্রয়

Dimitrios Zappas 09:20 2025-07-28 UTC+2

স্বর্ণের ট্রেডিং সিগন্যাল (২৮–৩০ জুলাই, ২০২৫): মূল্য $3,320-এর (200 EMA - 5/8 মারে) উপরে থাকা অবস্থায় ক্রয় করুন

ইউরোপীয় সেশনের শুরুতে, স্বর্ণ 3,331-এর আশেপাশে ট্রেড করছে, যেখানে স্বর্ণের মূল্য 5/8 মারে লেভেল সংলগ্ন গুরুত্বপূর্ণ সাপোর্ট জোনে পৌঁছানোর পর রিবাউন্ড করছে। স্বর্ণের গত সপ্তাহের দরপতন কিছুটা পুনরুদ্ধার হতে পারে

Dimitrios Zappas 08:11 2025-07-28 UTC+2

স্বর্ণের (XAU/USD) ট্রেডিং সিগন্যাল (২৫–২৮ জুলাই, ২০২৫): স্বর্ণের মূল্য $3,359-এর ওপরে থাকলে ক্রয় করুন এবং $3,392-এর (21 SMA – 6/8 মারে) নিচে থাকলে বিক্রি করুন

স্বর্ণ বর্তমানে $3,359-এর আশেপাশে ট্রেড করছে, যা 6/8 মারে-এর গুরুত্বপূর্ণ সাপোর্টের ঠিক ওপরে অবস্থিত এবং স্বর্ণের মূল্য 21 SMA-এর নিচে অবস্থান করছে। সম্প্রতি স্বর্ণের মূল্য 8/8 মারে-এর শক্তিশালী রেজিস্ট্যান্স লেভেল

Dimitrios Zappas 09:22 2025-07-25 UTC+2

বিটকয়েনের ট্রেডিং সিগন্যাল (২৫–২৮ জুলাই, ২০২৫): মূল্য $115,000-এর (5/8 মারে – 21 SMA) উপর থাকা অবস্থায় বিটকয়েন কিনুন

যদি বিটকয়েনের দরপতন অব্যাহত থাকে, তাহলে $115,000 (5/8 মারে) লেভেলের নিচে কনসোলিডেশন হতে পারে, যার ফলে BTC-এর মূল্য প্রথমে $113,519 (200 EMA) এবং তারপর 4/8 মারে-এর কাছাকাছি $112,500 পর্যন্ত নেমে

Dimitrios Zappas 09:17 2025-07-25 UTC+2
এখন কথা বলতে পারবেন না?
আপনার প্রশ্ন জিজ্ঞাসা করুন চ্যাট.
 

Dear visitor,

Your IP address shows that you are currently located in the USA. If you are a resident of the United States, you are prohibited from using the services of InstaFintech Group including online trading, online transfers, deposit/withdrawal of funds, etc.

If you think you are seeing this message by mistake and your location is not the US, kindly proceed to the website. Otherwise, you must leave the website in order to comply with government restrictions.

Why does your IP address show your location as the USA?

  • - you are using a VPN provided by a hosting company based in the United States;
  • - your IP does not have proper WHOIS records;
  • - an error occurred in the WHOIS geolocation database.

Please confirm whether you are a US resident or not by clicking the relevant button below. If you choose the wrong option, being a US resident, you will not be able to open an account with InstaTrade anyway.

We are sorry for any inconvenience caused by this message.